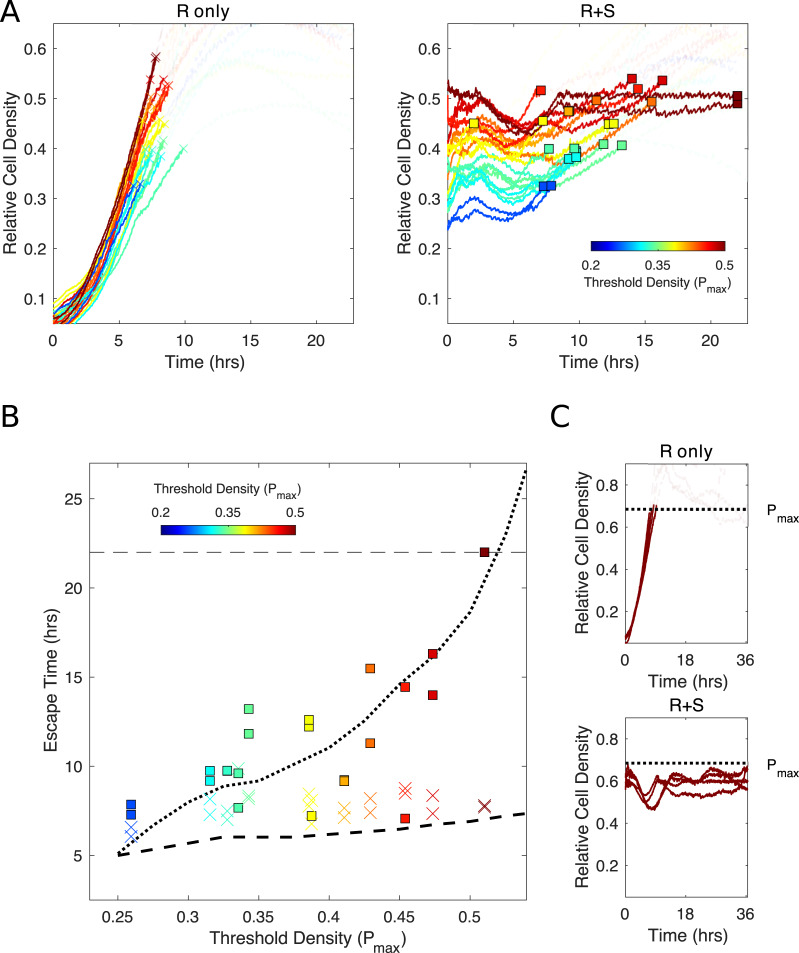
Fig 5. Escape time depends sensitively on Pmax for mixed, but not for R-only, population.
(A) Growth curves for R-only (left) and mixed (right) populations for different values of Pmax, ranging from 0.2 (blue) to 0.5 (red). Curves transition from opaque to transparent as they eclipse Pmax, and the crossover point is marked with an “×” (R-only populations) or square (mixed populations). (B) Failure time (i.e., time to cross threshold) for experiments in panel A (“×” for R-only, squares for mixed populations; note that one yellow square falls below the axis limits). Dotted (dashed) curves are predictions from theoretical model for mixed (R-only) populations. (C) Example long-term (35+hours) experiment in the regime in which Pmax is larger than the steady-state population density. As in panel A, growth curves become transparent after crossing threshold. In all curves, density is measured relative to carrying capacity in a unperturbed bioreactors (see S2 Fig). Data are deposited in the Dryad repository: https://doi.org/10.5061/dryad.s4mw6m943 [62]. Pmax, acceptable burden; R, resistant; S, sensitive.

