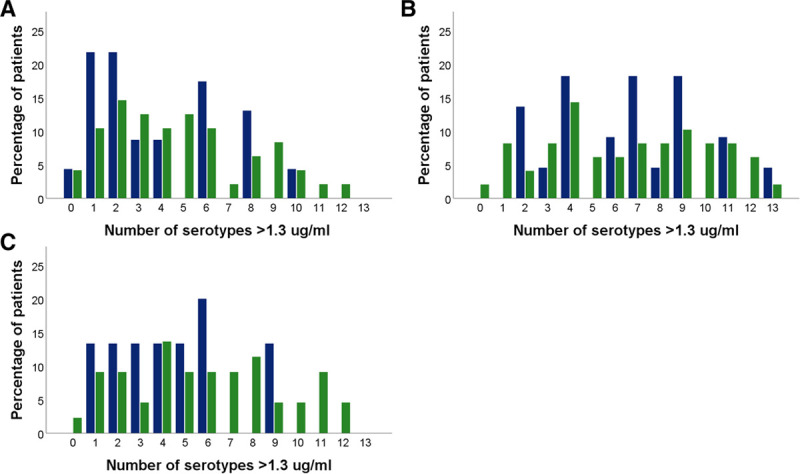
FIGURE 6.

Number of lung transplant recipients with a given number of serotype-specific antibody levels ≥1.3 µg/mL. Blue bars represent lung transplant recipients from the current study (n = 15), and green bars represent lung transplant recipients from a previously described cohort, who were vaccinated with 23vPPV alone (n = 49). (A) before vaccination, median (IQR, 2 [1–8] compared with 5 [3–8]; P = 0.205); (B) after vaccination, in case of the current cohort after vaccination with both vaccines, median (IQR) 7 [4–9] compared with 7 [4–10]; P = 0.975); (C) 1 y after vaccination, median 4 (2–6) compared with 6 (3–8), P = 0.137. IQR, interquartile range; 23vPPV, 23-valent pneumococcal polysaccharide vaccine.
