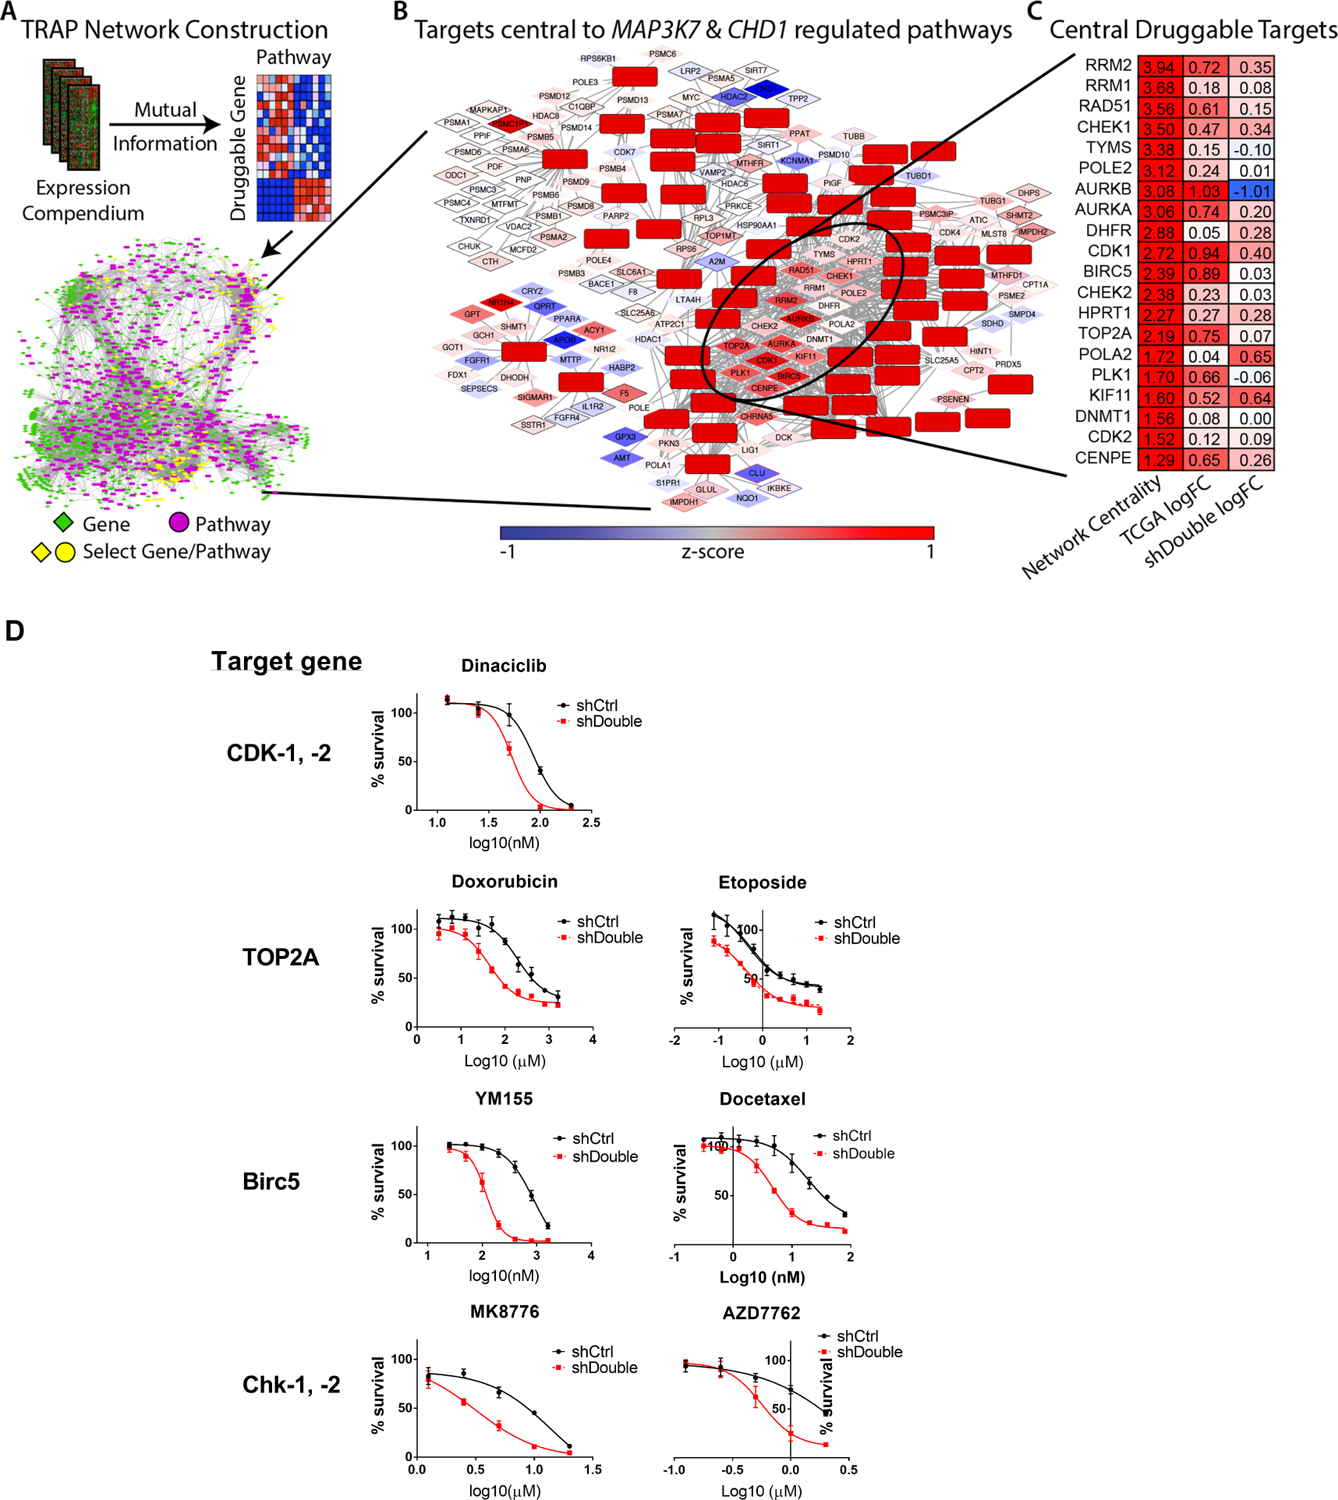
Figure 1: TRAP analysis and validation in WFU3 cells.

A: The TRAP network construction workflow is shown. A human gene expression compendium of over 3,500 expression profiles was compiled. Druggable genes were defined using DGIdb and canonical pathways using the C2.CP gene sets from MSigDB. Mutual Information was calculated for all druggable genes/canonical pathway pairs; significant relationships define the edges in the TRAP network, which is the background model that defines how druggable genes are connected to pathways. See Methods section for more detail.
B: TCGA patient tumors with co-loss of CHD1 & MAP3K7 were used to identify significantly up-regulated pathways. These pathways and their direct druggable gene neighbors were selected from the TRAP network and the most centrally located genes were identified..
C: The top 20 druggable target genes are shown. Network centrality from the TRAP analysis, the log-fold change between TCGA patients with co-loss of CHD1 & MAP3K7 and those diploid at CHD1 & MAP3K7, and the log-fold change between WFU3 shDouble and shCtrl..
D: Dose-response curves of candidate drugs in cell growth of WFU3 shControl (black) versus shDouble (red). Cells were treated with each drug for 48hr and cell growth was assessed by % confluence of each well in IncuCyte Zoom. Data are shown by mean and SE (n=3–5 per group). These results are representative of three independent experiments.
