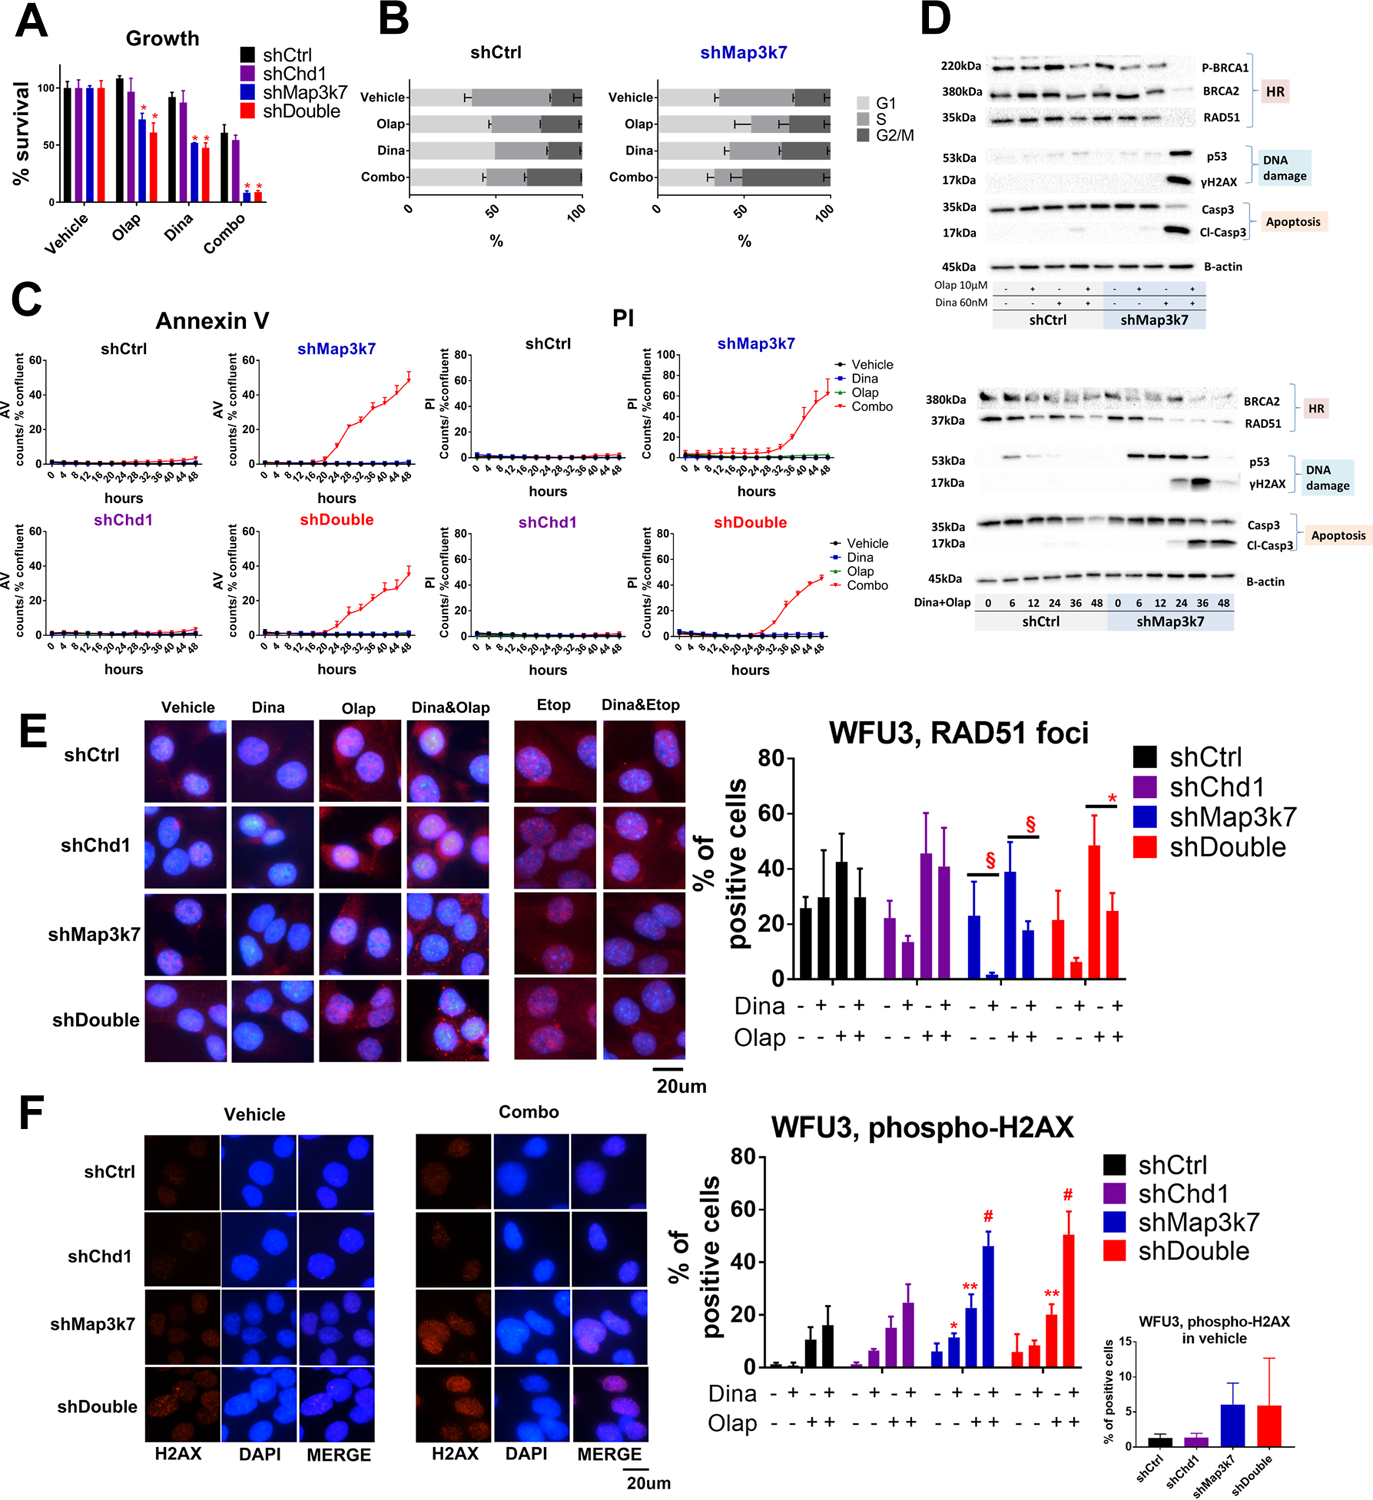
Figure 5: The combination therapy of dinaciclib and olaparib in WFU3.

A: Anti-proliferative effects in response to vehicle, dinaciclib (60nM), olaparib (10μM) or the combination of dinaciclib and olaparib in WFU3 shControl, shChd1, shMap3k7 and shDouble. The combination of dinaciclib and olaparib inhibited the cell growth of WFU3 with suppression of Map3k7 without regard to Chd1 status. Cells were treated with these drugs for 48hr. * p<0.0001 compared to WFU3 shControl by two-way ANOVA with Dunnett’s multiple comparisons test. Data are shown by mean and SE (n=3 per group). The results are representative of three independent experiments.
B: The results of cell cycle analysis in response to vehicle, dinaciclib (60nM), olaparib (10μM) or the combination of dinaciclib and olaparib in WFU3 shControl and shMap3k7. Cells were treated with these drugs for 24hr. Data are shown by mean and SE (n=3 per group). The results are representative of two independent experiments.
C: Time course of Annexin V and PI positive cells in response to vehicle (black), dinaciclib (60nM; blue), olaparib (10μM; green), or the combination (red) in WFU3 shControl, shMap3k7, shChd1, versus shDouble. Cells were treated with these drugs for up to 48hr. Data are shown by mean and SE (n=3 per group). The results are representative of three independent experiments.
D: HR-related proteins were selectively suppressed in WFU3 shMap3k7 in response to the combination of dinaciclib (60nM) and olaparib (10μM), which was accompanied by induction of ɤH2AX, p53, and cleaved caspase-3. Cells were treated with drugs for 36hr. Time dependent reduction of BRCA2 and RAD51 accompanied by increases in p53, ɤH2AX and cleavage caspase-3 in response to the combination dinaciclib and olaparib are also shown. The results are representative of at least two independent experiments.
E: RAD51 foci were selectively suppressed in WFU3 shMap3k7 and shDouble in response to the dinaciclib (60nM) with or without olaparib (10μM)/ etoposide (10μM). Cells were treated with drugs for 12hr. Pictures are representative of merged images of RAD51 foci with DAPI. § p<0.1, * p<0.05 by two-way ANOVA with Tukey’s multiple comparisons test. Data are shown by mean and SE (n=3 per group).
F: ɤH2AX foci were more observed in WFU3 shMap3k7 and shDouble in vehicle condition (small graph) as well as in response to the dinaciclib (60nM) and/or olaparib (10μM) (large graph) compared to WFU3 shControl. Cells were treated with drugs for 36hr. Pictures are representative of images of ɤH2AX foci, DAPI, and merge. * p<0.05, ** p<0.01, # p<0.0001 vs shControl by two-way ANOVA with Dunnet’s multiple comparisons test. Data are shown by mean and SE (n=3 per group).
