
Figure 6: The combination therapy of dinaciclib and docetaxel in BHPrE1.
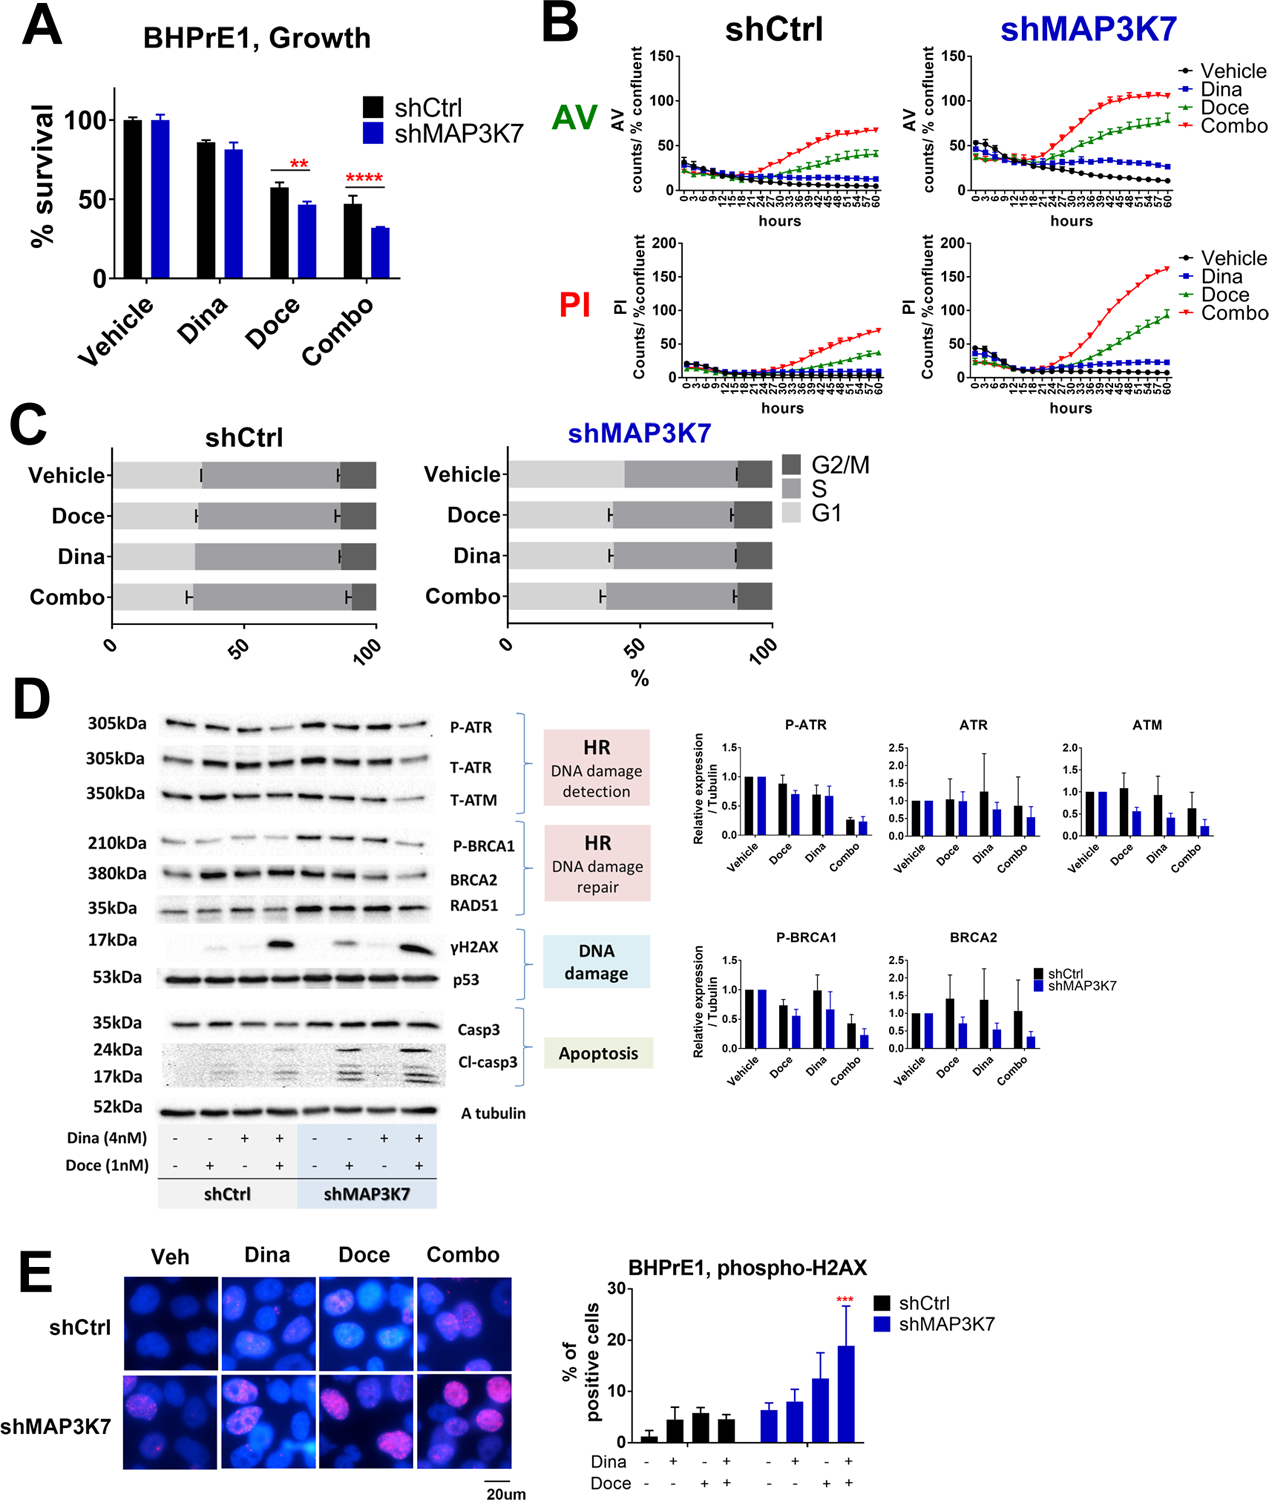
A: Cell growth assay in response to vehicle, dinaciclib (4nM), docetaxel (1nM), or the combination of dinaciclib and docetaxel in BHPrE1 shControl versus shMAP3K7 are shown. Cells were treated with these drugs for 72hr and cell growth was assessed using CellTiterGlo. ** p<0.01 and **** p<0.0001 by two-way ANOVA with Sidak’s multiple comparisons test. Data are shown by mean and SE (n=3 per group). These results are representative of three independent experiments.
B: Time course of Annexin V and PI positive cells in BHPrE1 shControl versus BHPrE1 shMAP3K7 in response to vehicle (black), Dinaciclib (4nM; blue), docetaxel 1nM (green) or the combination of dinaciclib and docetaxel (red). Cells were treated with these drugs for up to 60hr. Data are shown by mean and SE (n=3 per group). These results are representative of three independent experiments.
C: Cell cycle analyses in BHPrE1 shControl and shMAP3K7 in response to vehicle, dinaciclib (4nM), docetaxel (1nM) or the combination of dinaciclib and docetaxel. Cells were treated with these drugs for 24hr. Data are shown by mean and SE (n=3 per group). These results are representative of two independent experiments.
D: Cells were treated with vehicle, dinaciclib (4nM), docetaxel (1nM), or the combination of dinaciclib and docetaxel for 48hr before harvesting. HR-related proteins were suppressed by the combination therapy compared to each single agent, and this was accompanied by induction of ɤH2AX and cleaved caspase-3. These results are representative (bands) and mean and SE (bar graphs) of three independent experiments.
E: ɤH2AX foci increased in BHP shMAP3K7 in vehicle condition as well as in response to the dinaciclib (4nM) and docetaxel (1nM). Cells were treated with drugs for 24hr. Pictures are representative of merged images of ɤH2AX foci with DAPI. The results are representative of two independent experiments (n=3 per each group). *** p<0.001 vs BHPrE1 shControl by two-way ANOVA with Dunnet’s multiple comparisons test. Data are shown by mean and SE (n=3 per group).