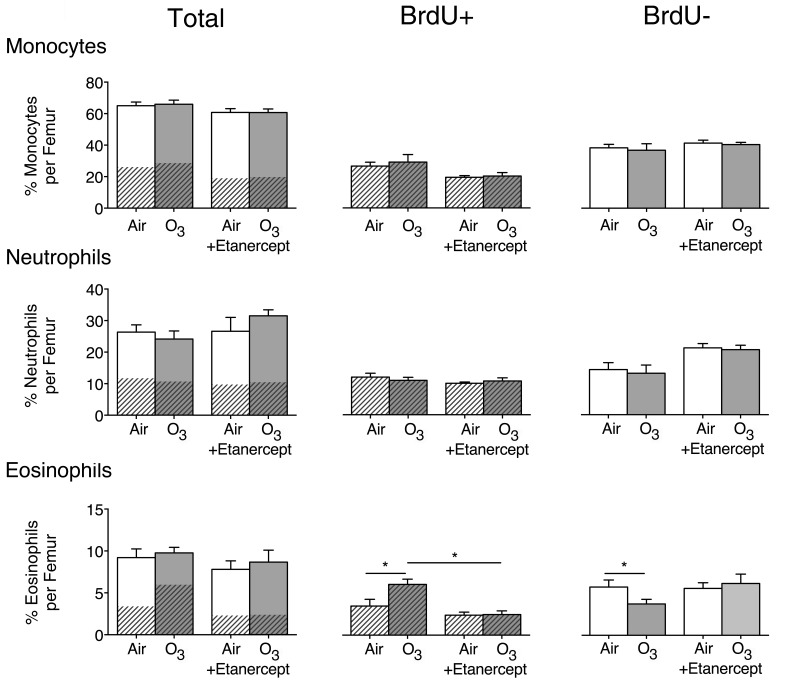
Figure 15.
Newly divided inflammatory cells (BrdU+) on day 3 in bone marrow for nonsensitized guinea pigs that were treated with etanercept 3 hours before a 4-hour exposure to 2 ppm ozone or filtered air. BrdU+ newly divided cells are shown as hatched bars or hatched portions of bars; BrdU– preformed cells are shown as not hatched (white or solid color). Data from animals exposed to filtered air are shown in white bars; data from animals exposed to ozone are in grey bars. The first pair of bars in each column is identical to the day 3 data in Figure 7 (nonsensitized); the data are reproduced here to allow statistical comparison. Data are expressed as percentage of total cells in the bone marrow of the left femur, mean ± SEM. Filtered air day 3 (n = 9), ozone day 3 (n = 8), filtered air day 3 + etanercept (n = 6), and ozone day 3 + etanercept (n = 6). Horizontal bars show comparisons: * = P < 0.05 by one-way ANOVA with a Bonferroni correction.

