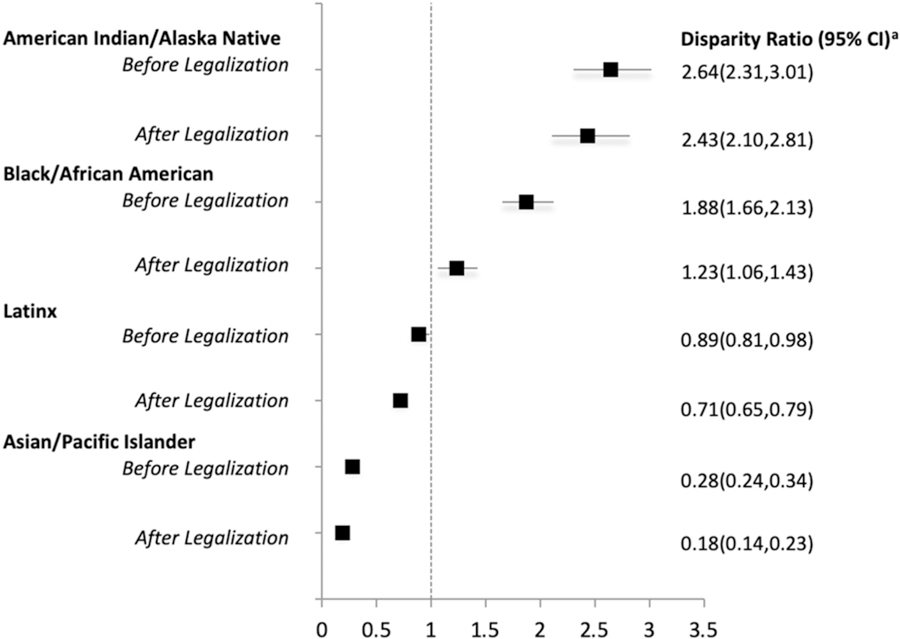
Figure 3.
Rate ratios comparing each racial/ethnic group to white youth for juvenile cannabis allegations pre/post adult legalization of cannabis.
aThe negative binomial models included an offset for age, gender, and race/ethnicity-specific annual population estimates. The model was adjusted for age, gender, and month that allegation occurred. White youth were used as the referent category. From linear contrasts, the disparity ratio did not significantly reduce for American Indian/Alaska Natives after legalization (p-value: 0.412); significantly reduced for black/African Americans (p-value: <0.001), Latinx (p-value: 0.001), and Asian/Pacific Islanders (p-value: 0.002).

