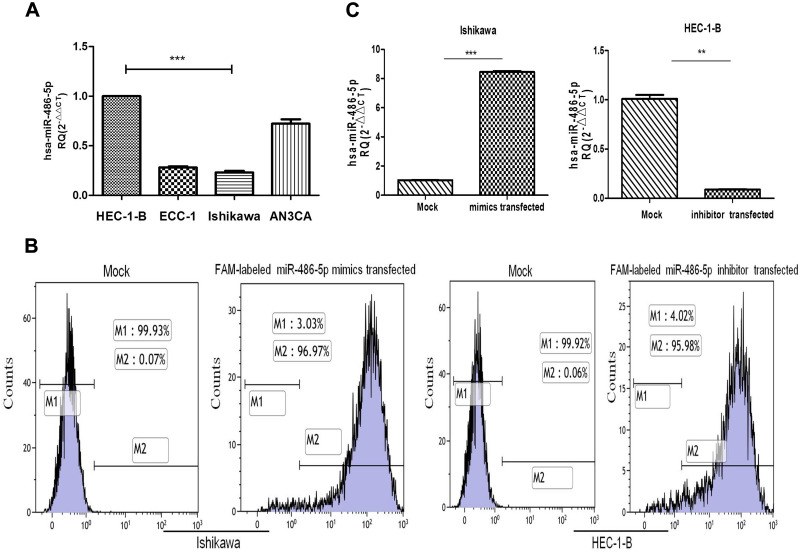
Figure 2.
Expression levels of miR-486-5p in cell lines and the efficiency of transfected cells. (A) Relative expression of miR-486-5p in EC cell lines, analyzed by RT-qPCR. ***P<0.001. (B) Cells were harvested 24 h after transfection and analyzed on a flow cytometer. (C) The level of miR-486-5p was determined by RT-PCR, the fold-change of miR-486-5p level was determined by the 2−ΔΔCt method. Cell lines were transfected with miR-486-5p mimic or inhibit, and their corresponding NC. Data are expressed as the mean ± SD. **P<0.05, ***P<0.001.

