
Figure 2.
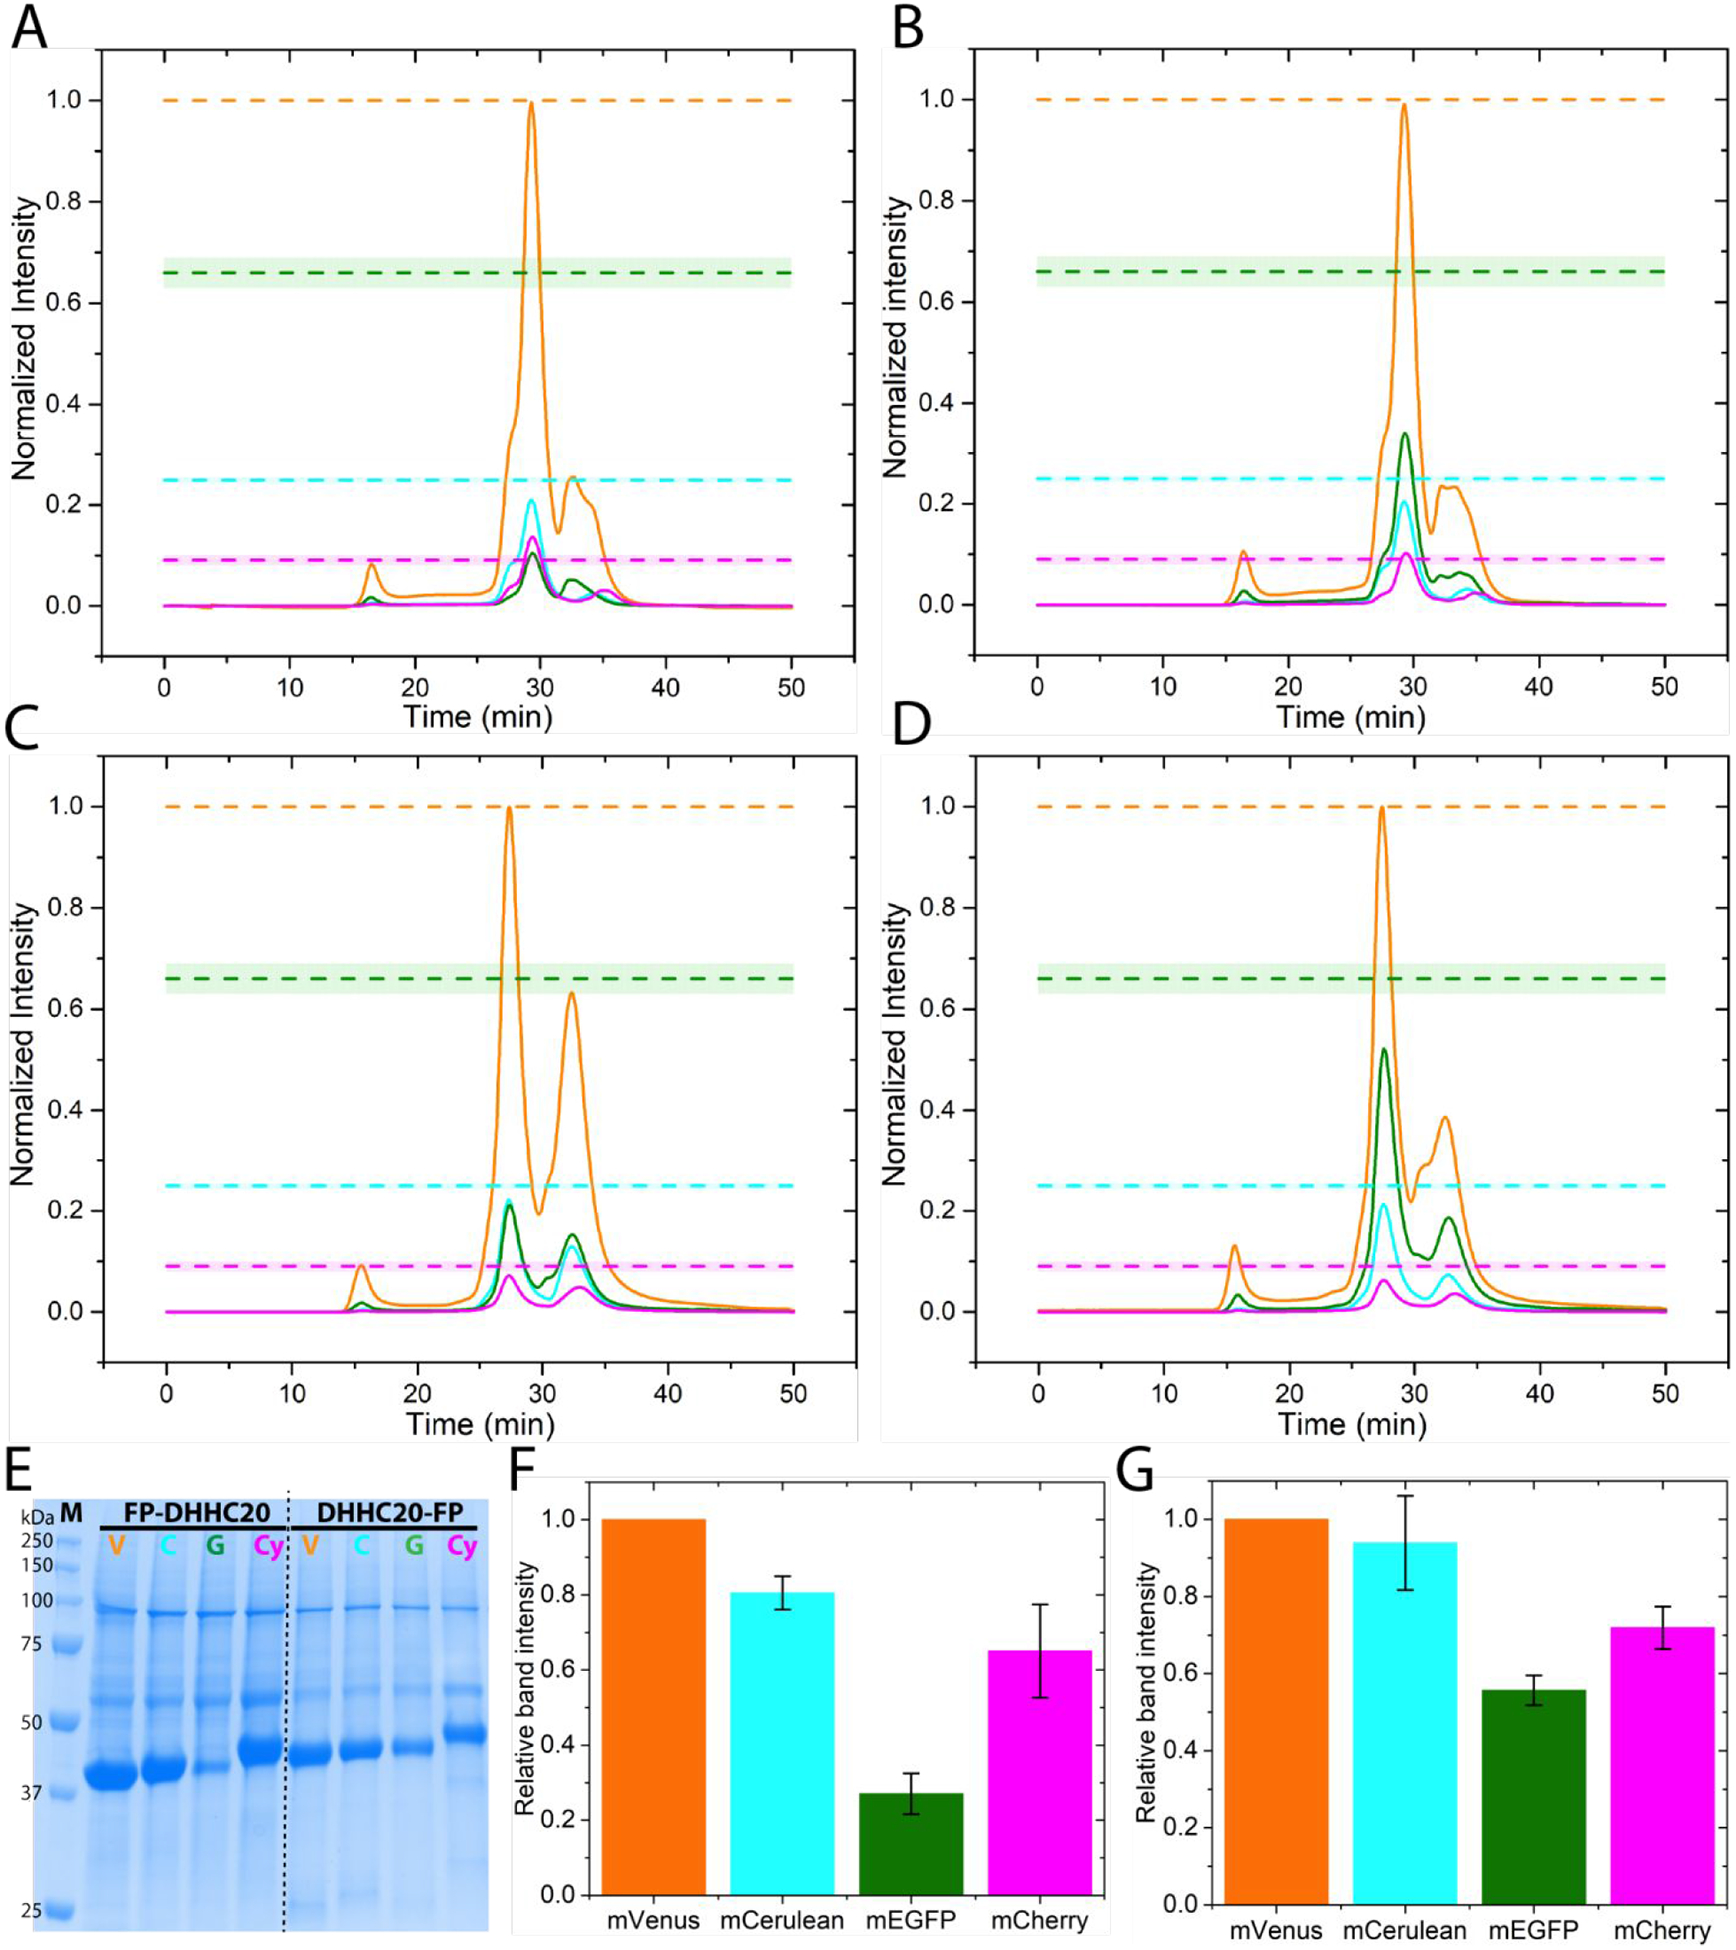
Over-expression of human DHHC20 tagged with the different fluorescent proteins (FP). (A) FSEC traces of N-terminal FP tagged DHHC20 transiently over-expressed in HEK293T cells at 37°C, mVenus-DHHC20 (orange), mCerulean-DHHC20 (cyan), mEGFP-DHHC20 (green), mCherry-DHHC20 (magenta). (B) The same as (A) but at an incubation temperature of 30°C. (C) FSEC traces of C-terminal FP tagged DHHC20 transiently over-expressed in HEK293T cells at 37°C. Color code as in (A). (D) The same as (C) but at 30°C. The dashed lines indicate the expected peak heights for mCerulean(cyan), mEGFP (green), and mCherry (magenta) relative to the mVenus (orange) tagged protein if they all expressed equally well. All chromatograms are averages from two independent experiments. (E) SDS-PAGE analysis of metal affinity purified N- and C-terminal FP tagged DHHC20. mVenus, V; mCerulean, C; mEGFP, G; mCherry, Cy. (F) Quantitation of relative expression levels for N-terminal FP tagged DHHC20. (G) Quantitation of relative expression levels for C-terminal FP tagged DHHC20. Color code as in (A). Values in bar graphs are mean±sd of two independent experiments.