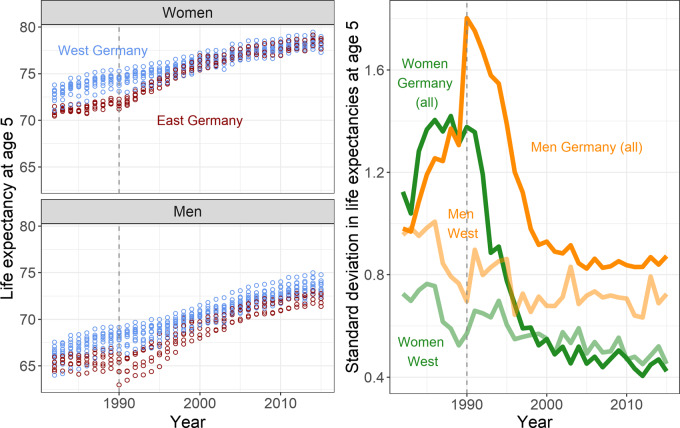
Figure 1.
Life expectancy at age 5 years (e5) for each German state (left panels) and the standard deviation in e5 (right panel) by sex; 1982–2015 (in years). The lighter lines in the right panel refer to the subset of states in western Germany. The vertical line at 1990 demarks the German reunification—lines prior to 1990 are of a hypothetical united Germany.

