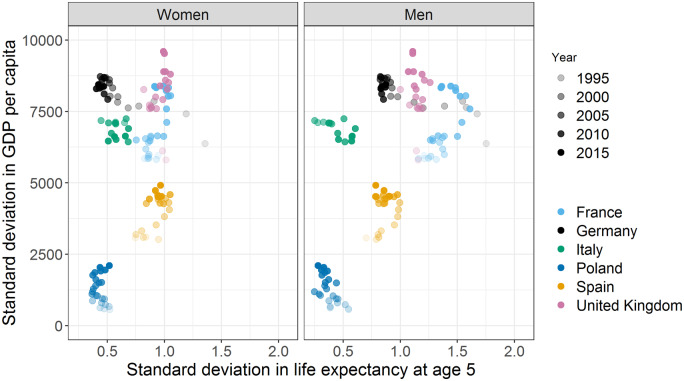
Figure 3.
Association between state-level inequalities in life expectancy at age 5 years and state-level inequalities in GDP per capita in Germany and in selected European countries. (i) Each point refers to a country value in a given year between 1991 and 2015. (ii) Data sources and method description are available in the Online Supplementary Appendix, available as Supplementary data at IJE online). The standard deviation in GDP per capita is for both sexes combined.

