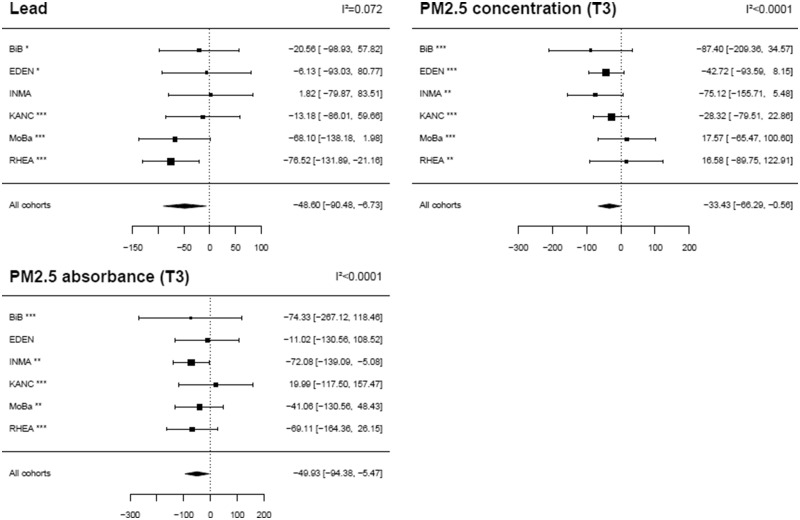
Figure 2.
Adjusted effect measure of exposures on birth weight by cohort (ExWAS approach). Estimates are given as a change in mean birth weight (g) for each inter-quartile range (defined over all observations) increase in exposure (normalized and corrected for measurement error). Only exposures with an uncorrected P-value < 5% in the main ExWAS (i.e. without cohort–exposure interaction) are reported. Black squares display the coefficient estimates, and the horizontal lines their 95% CIs. The values of the coefficients (95% CI) are given on the right-hand side of the graphs; on the left-hand side, a symbol displays the proportion of missing values that were imputed for the given exposure variable in each cohort (*** <10% of imputed values, **10–50% of imputed values, * 50–80% of imputed values, no symbol indicates more than 80% of imputed values). The exposures distribution is displayed in Supplementary Figure S3, available as Supplementary data at IJE online. Associations were adjusted for gestational duration (simple and quadratic terms), sex of the newborn, parity, maternal height, maternal weight before pregnancy (using a broken stick model with a knot at 60 kg), maternal smoking during the second trimester of pregnancy, maternal education, season of conception and cohort (fixed effect variable). T3, averaged over the third trimester of pregnancy.

