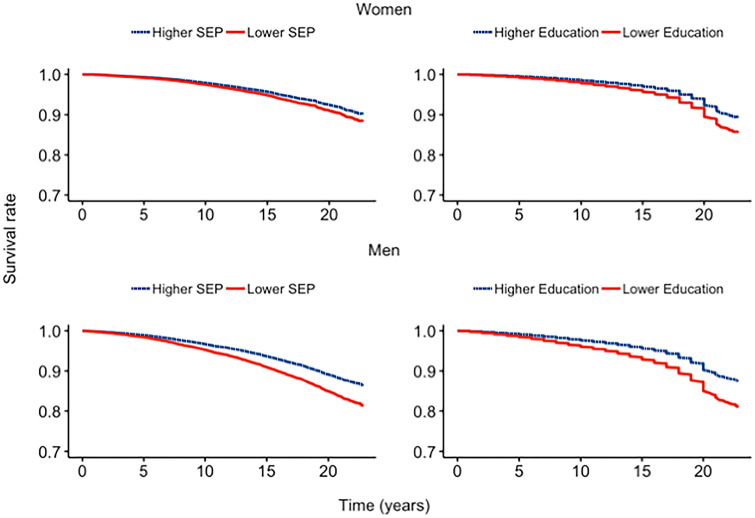
Figure 2.
Survival curves for women and men by two socio-economic indicators of socio-economic position (SEP) and education, adjusted for age, marital status and cohort. Higher socioeconomic indicators are represented by the dotted lines and lower socioeconomic indicators are represented by solid lines.

