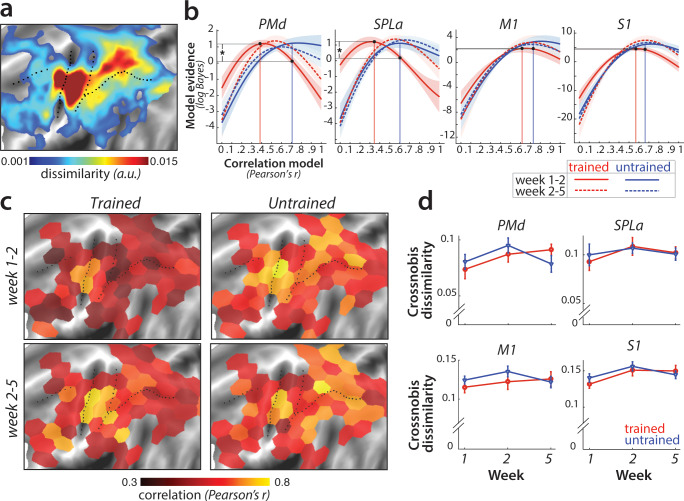
Figure 6. Sequence-specific activity patterns reorganize across sessions.
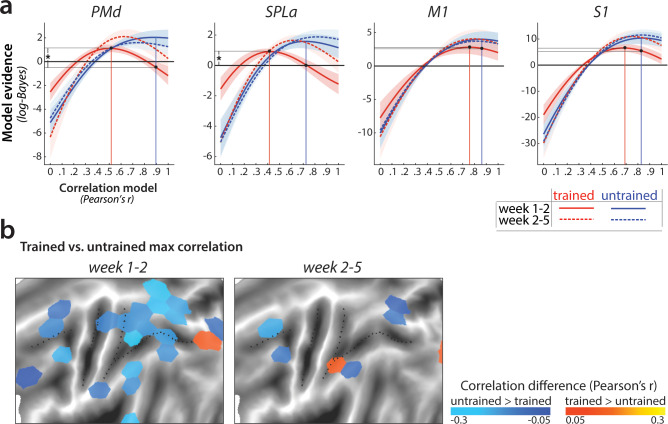
(a) Cortical surface map of crossnobis dissimilarities between activity patterns for different sequences in session 1. These regions encode which sequence is executed by the participant. (b) Evidence of models of correlation values between r = 0 and r = 1 for sequence-specific patterns across weeks 1–2 (solid) and 2–5 (dashed), separately for trained (red) and untrained (blue) sequences. Evidence was assessed with a type-II log-likelihood, relative to the average log-likelihood across models. Shaded areas indicate standard error across participants. Difference between log-likelihoods can be interpreted as a log-Bayes factor, with a difference of 1 indicating positive evidence. Vertical lines indicate the winning correlation model for trained (red) and untrained (blue) patterns across weeks 1–2. Black dots are projections of the two winning models onto the correlation function of trained sequences across weeks 1–2. The horizontal lines from the two black dots indicate the likelihood of the trained data under the two models, which was tested in a crossvalidated t-test. See Figure 6—figure supplement 1a for the same analysis with error trials excluded. (c) Map displaying the correlation of the winning model for trained and untrained sequences across weeks 1–2 and 2–5. The correlation of the winning correlation model is shown in all tessels where the difference between evidence for winning model vs. worst-fitting model exceeds log-Bayes factor of 1 (averaged across participants). See Figure 6—figure supplement 1b for the difference in best model correlation between trained and untrained sequences, and an indication of tessels where the difference is significant, as based on the crossvalidated t-test. (d) Crossnobis dissimilarities between trained and untrained sequence pairs across weeks. No significant effect of week, sequence type or their interaction was observed in any of the regions. Error bars indicate standard error across participants.


