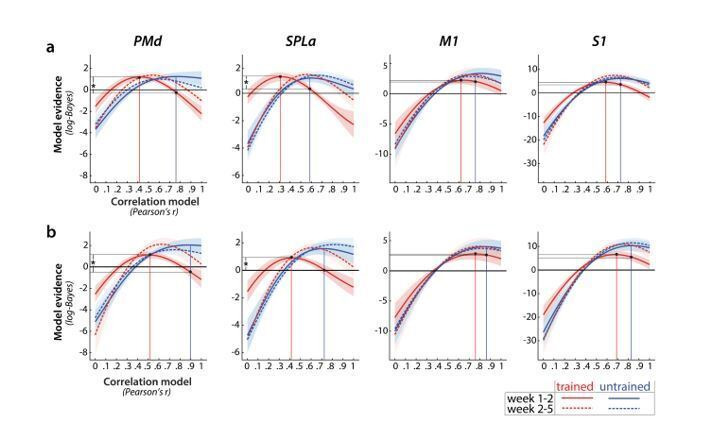
Author response image 2. Relative log-evidence (log marginal likelihood) for different correlation models across sessions (week 1-2 in solid lines, week 2-5 in dotted lines) for trained (red) and untrained (blue) activity patterns.

Regions: PMd (dorsal premotor cortex), SPLa (superior parietal lobule – anterior part), M1 (primary motor cortex), S1 (primary somatosensory cortex). Difference between log-likelihoods can be interpreted as log-Bayes factor, with a difference of 1 indicating positive evidence. Vertical lines indicate the winning correlation model for trained (red) and untrained (blue) patterns across weeks 1-2. Black dots are projections of the two winning models onto the correlation function of trained sequences (weeks 1-2). The horizontal lines from the two black dots indicate the likelihood of the trained data under the two models, which was tested in a cross validated t-test. a) Evidence based on preprocessing, reported in manuscript (here just adjusted in y-axis. b) Evidence for correlations after removing error trials from a general linear model estimation.
