. 2020 Apr 27;9:e55965. doi: 10.7554/eLife.55965

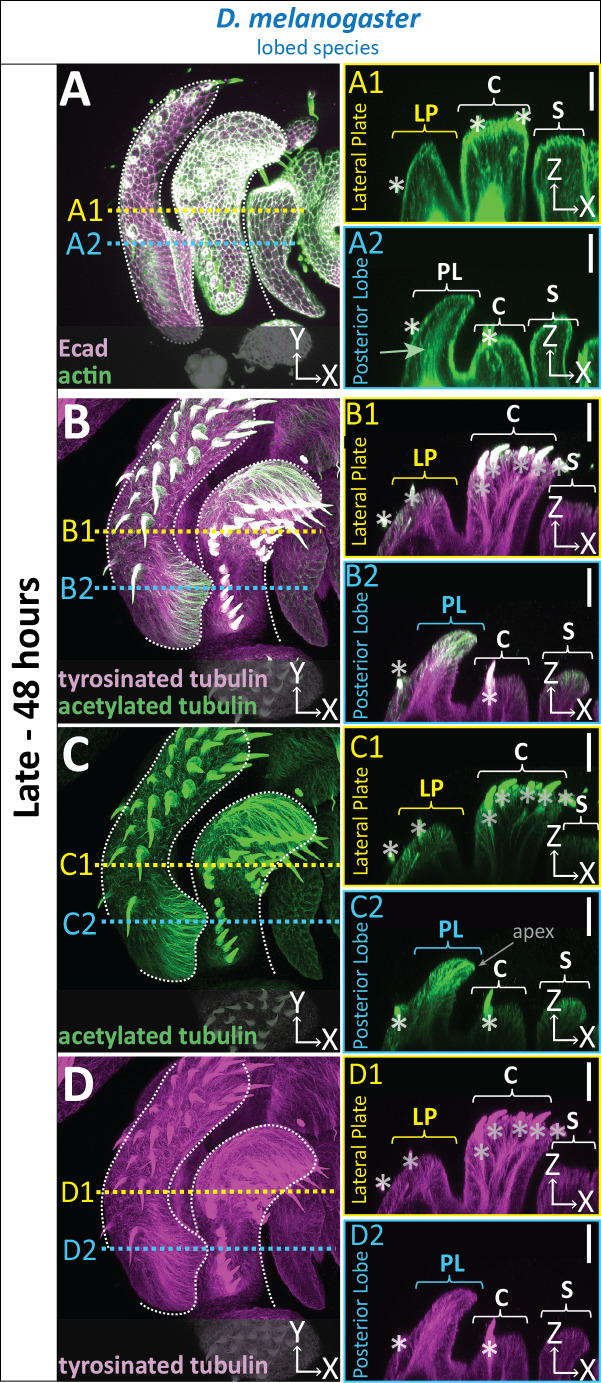
Figure 3. Cytoskeletal components are increased in posterior lobe cells.

(A–D) Maximum projection, and respective cross-sections of late (48 hr APF) genital samples of the lobed species D. melanogaster labeled with F-actin/phalloidin (actin; green) and E-cadherin (Ecad; magenta) (A), acetylated tubulin (green) (B,C), and tyrosinated tubulin (magenta) (B,D). Location of respective cross sections indicated in yellow for lateral plate (A1–D1) and blue for posterior lobe (A2–D2). Cross-sections are maximum projections of a restricted 5.434 μm thick section to provide a complete view of cytoskeletal components along the apico-basal axis. All cross-sections are oriented with apical side at the top and basal side at the bottom. Asterisk identifies bristles which have high levels of F-actin and tubulin. Bright basal signal in A1 and A2 are fat bodies. Bottom layers were removed in panel A to remove fat body signal which overwhelmed other details. (B–D2) Panels C and D show separate channels of panel B. Relevant structures labeled: Posterior lobe (PL), lateral plate (LP), clasper (C), and sheath (S). Scale bar, 20 μm. n ≥ 3 per experiment.

Figure 3.

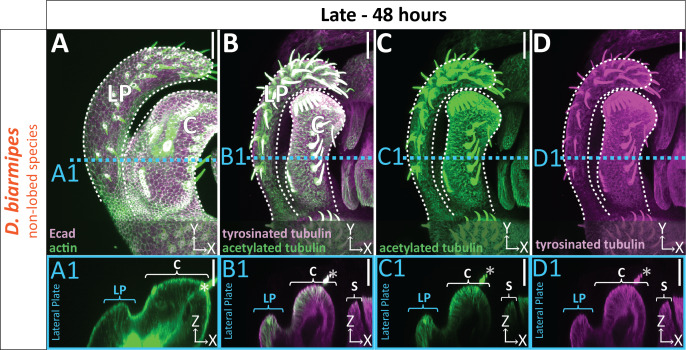
Figure 3—figure supplement 1. Uniform level of cytoskeletal components in non-lobed species.

Figure 3—figure supplement 1.

(A–D) Max projections of late (48 hr APF) genital samples of non-lobed species D. biarmipes labeled with F-actin/phalloidin (green) and E-cadherin (Ecad; magenta) (A), acetylated tubulin (green) (B,C), and tyrosinated tubulin (magenta) (B,D). Location of respective cross sections indicated in blue for presumptive posterior lobe cells (A1–D1). Cross-sections are maximum projection of a restricted 5.434 μm thick section to display the full view of the cytoskeleton along the apico-basal axis. All cross-sections are oriented with apical side at the top and basal side at the bottom. Asterisk identifies bristles which have high levels of F-actin and tubulin. Bright basal signal in A1 is from fat bodies. Bottom layers were removed in panel A to avoid fat body signal which masked other details. Panels C and D show separate channels of panel B. Relevant structures labeled: Lateral plate (LP), clasper (C), and sheath (S) labeled. Scale bar, 20 μm. n ≥ 3 per experiment.