. 2020 May 26;128(5):057008. doi: 10.1289/EHP5779

Figure 3.

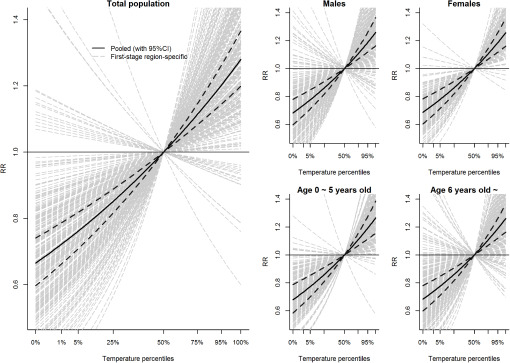
Figure 3 is a set of five graphs titled total population, males, females, age 0 equivalent to 5 years old, and age 6 years old equivalent to, respectively, plotting RR, ranging from 0.6 to 1.4 in increments of 0.2 (y-axis) across temperature percentiles, ranging from 0 to 100 in increments of 1, 4, 20, 25, 25, 20 up till 50, and 5 up till 100 in the first graph, and 0 to 95 percent in increments of 5, 45, and 45, respectively, (x-axis) for pooled (with 95 percent CI) and first-stage region-specific.

Pooled estimates [with 95% confidence interval (CI)] and city-specific estimate of temperature on bacillary dysentery in relative scale for total population, different age groups, and genders. Reference: 50th percentile of temperature.