. 2020 May 26;128(5):057008. doi: 10.1289/EHP5779

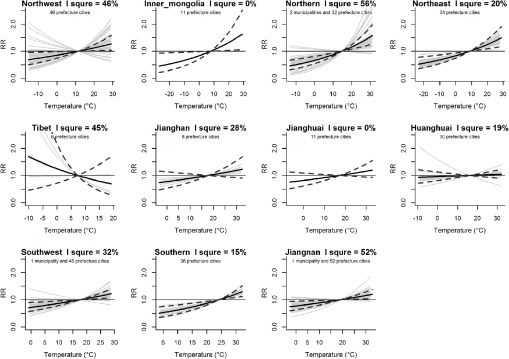
Figure 4.

Figure 4 is a set of eleven graphs. First graph titled Northwest 1 square equals 46 percent, 46 prefecture cities plots RR, ranging from 0.0 to 2.0 in increments of 1.0 (y-axis) across temperature (degree Celsius), ranging from negative 10 to 30 in increments of 10 (x-axis). Second graph titled Inner_mongolia 1 square equals 0 percent, 11 prefecture cities plots RR, ranging from 0.0 to 2.0 in increments of 1.0 (y-axis) across temperature (degree Celsius), ranging from negative 20 to 30 with increments of 10 (x-axis). Third graph titled Northern 1 square equals 56 percent, 2 municipalities and 32 prefecture cities plots RR, ranging from 0.0 to 2.0 in increments of 1.0 (y-axis) across temperature (degree Celsius), ranging from negative 10 to 30 in increments of 10 (x-axis). Fourth graph titled Northeast 1 square equals 20 percent, 34 prefecture cities plots RR, ranging from 0.0 to 2.0 in increments of 1.0 (y-axis) across temperature (degree Celsius), ranging from negative 20 to 30 in increments of 10 (x-axis). Fifth graph titled Tibet 1 square equals 45 percent, 6 prefecture cities plots RR, ranging from 0.0 to 2.0 in increments of 1.0 (y-axis) across temperature (degree Celsius), ranging from negative 10 to 20 with increments of 10 (x-axis). Sixth graph titled Jianghan 1 square equals 28 percent, 8 prefecture cities plots RR, ranging from 0.0 to 2.0 with increments of 1.0 (y-axis) across temperature (degree Celsius), ranging from 0 to 30 in increments of 5, 5, 10, and 10 (x-axis). Seventh graph titled Jianghuai 1 square equals 0 percent, 11 prefecture cities plots RR, ranging from 0.0 to 2.0 in increments of 1.0 (y-axis) across temperature (degree Celsius), ranging from 0 to 30 in increments of 10 (x-axis). Eighth graph titled Huaughuai 1 square equals 19 percent, 30 prefecture cities plots RR, ranging from 0.0 to 2.0 in increments of 1.0 (y-axis) across temperature (degree Celsius), ranging from negative 10 to 30 in increments of 10 (x-axis). Ninth graph titled Southeast 1 square equals 32 percent, 1 municipality and 46 prefecture cities plots RR, ranging from 0.0 to 2.0 in increments of 1.0 (y-axis) across temperature (degree Celsius), ranging from 0 to 30 in increments of 5 (x-axis). Tenth graph titled Southern 1 square equals 15 percent, 36 prefecture cities plots RR, ranging from 0.0 to 2.0 in increments of 1.0 (y-axis) across temperature (degree Celsius), ranging from 5 to 30 in increments of 5 (x-axis). Eleventh graph titled Jiangnan 1 square equals 52 percent, 1 municipality and 52 prefecture cities plots RR, ranging from 0.0 to 2.0 in increments of 1.0 (y-axis) across temperature (degree Celsius), ranging from 0 to 30 in increments of 5, 5, 10, and 10 (x-axis).

Region-specific estimates of mean temperature on bacillary dysentery. Black solid line with dark grey dashed lines represent the regional pooled effect with 95% confidence interval (CI), whereas the solid light grey lines are the city-specific estimates. For Jianghuai and Inner Mongolia, the pooled estimate lines overlie the first-stage estimates.