. 2020 May 26;128(5):057008. doi: 10.1289/EHP5779

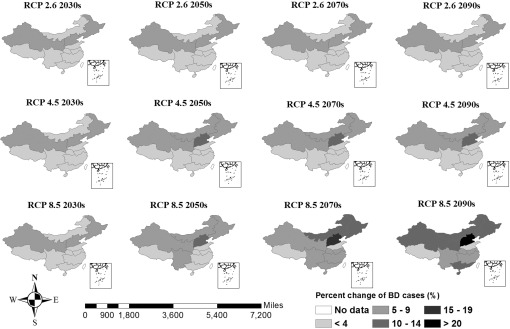
Figure 6.

Figure 6 is a set of twelve maps of China titled RCP 2.6 2030s, RCP 2.6 2050s, RCP 2.6 2070s, RCP 2.6 2090s, RCP 4.5 2030s, RCP 4.5 2050s, RCP 4.5 2070s, RCP 4.5 2090s, RCP 8.5 2030s, RCP 8.5 2050s, RCP 8.5 2070s, and RCP 8.5 2090s, plotting percent change of BD cases, namely, no data, less than 4, 5 to 9, 10 to 14, 15 to 19, and greater than 20, and each including an expanded part of the map. There is a compass and a scale at the bottom, ranging from 0 to 7,200 miles; the parts ranging from 0 to approximate 450, 900 to approximate 1,200, 1,800 to 3,600, and 5,400 to 7,200 have been highlighted.

Projected percent change of bacillary dysentery due to temperature increase by scenarios and years in China under assumptions of no change in population sizes and adaptation. Corresponding numeric data are reported in Table S5.