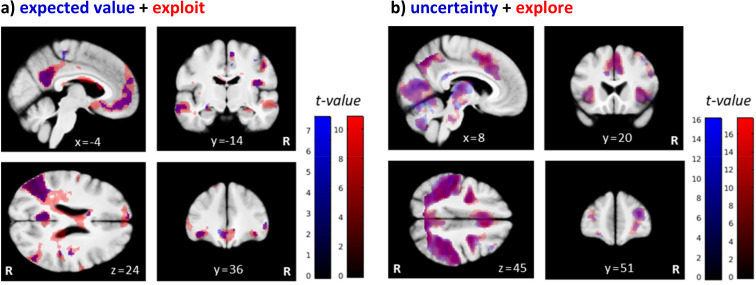
Figure 7. Brain regions differentially activated by exploratory and exploitative choices.
Shown are overlays of statistical parametric maps (SPMs) for the contrast (a) the parametric regressor expected value ( of the chosen bandit (in blue) and the binary trial classification related contrast exploit > explore (‘exploit’ in red), and for (b) the parametric regressor uncertainty () (in blue) and the contrast explore > exploit (‘explore’ in red), over all drug conditions. For visualization purposes: thresholded at p<0.001, uncorrected. R: right.

