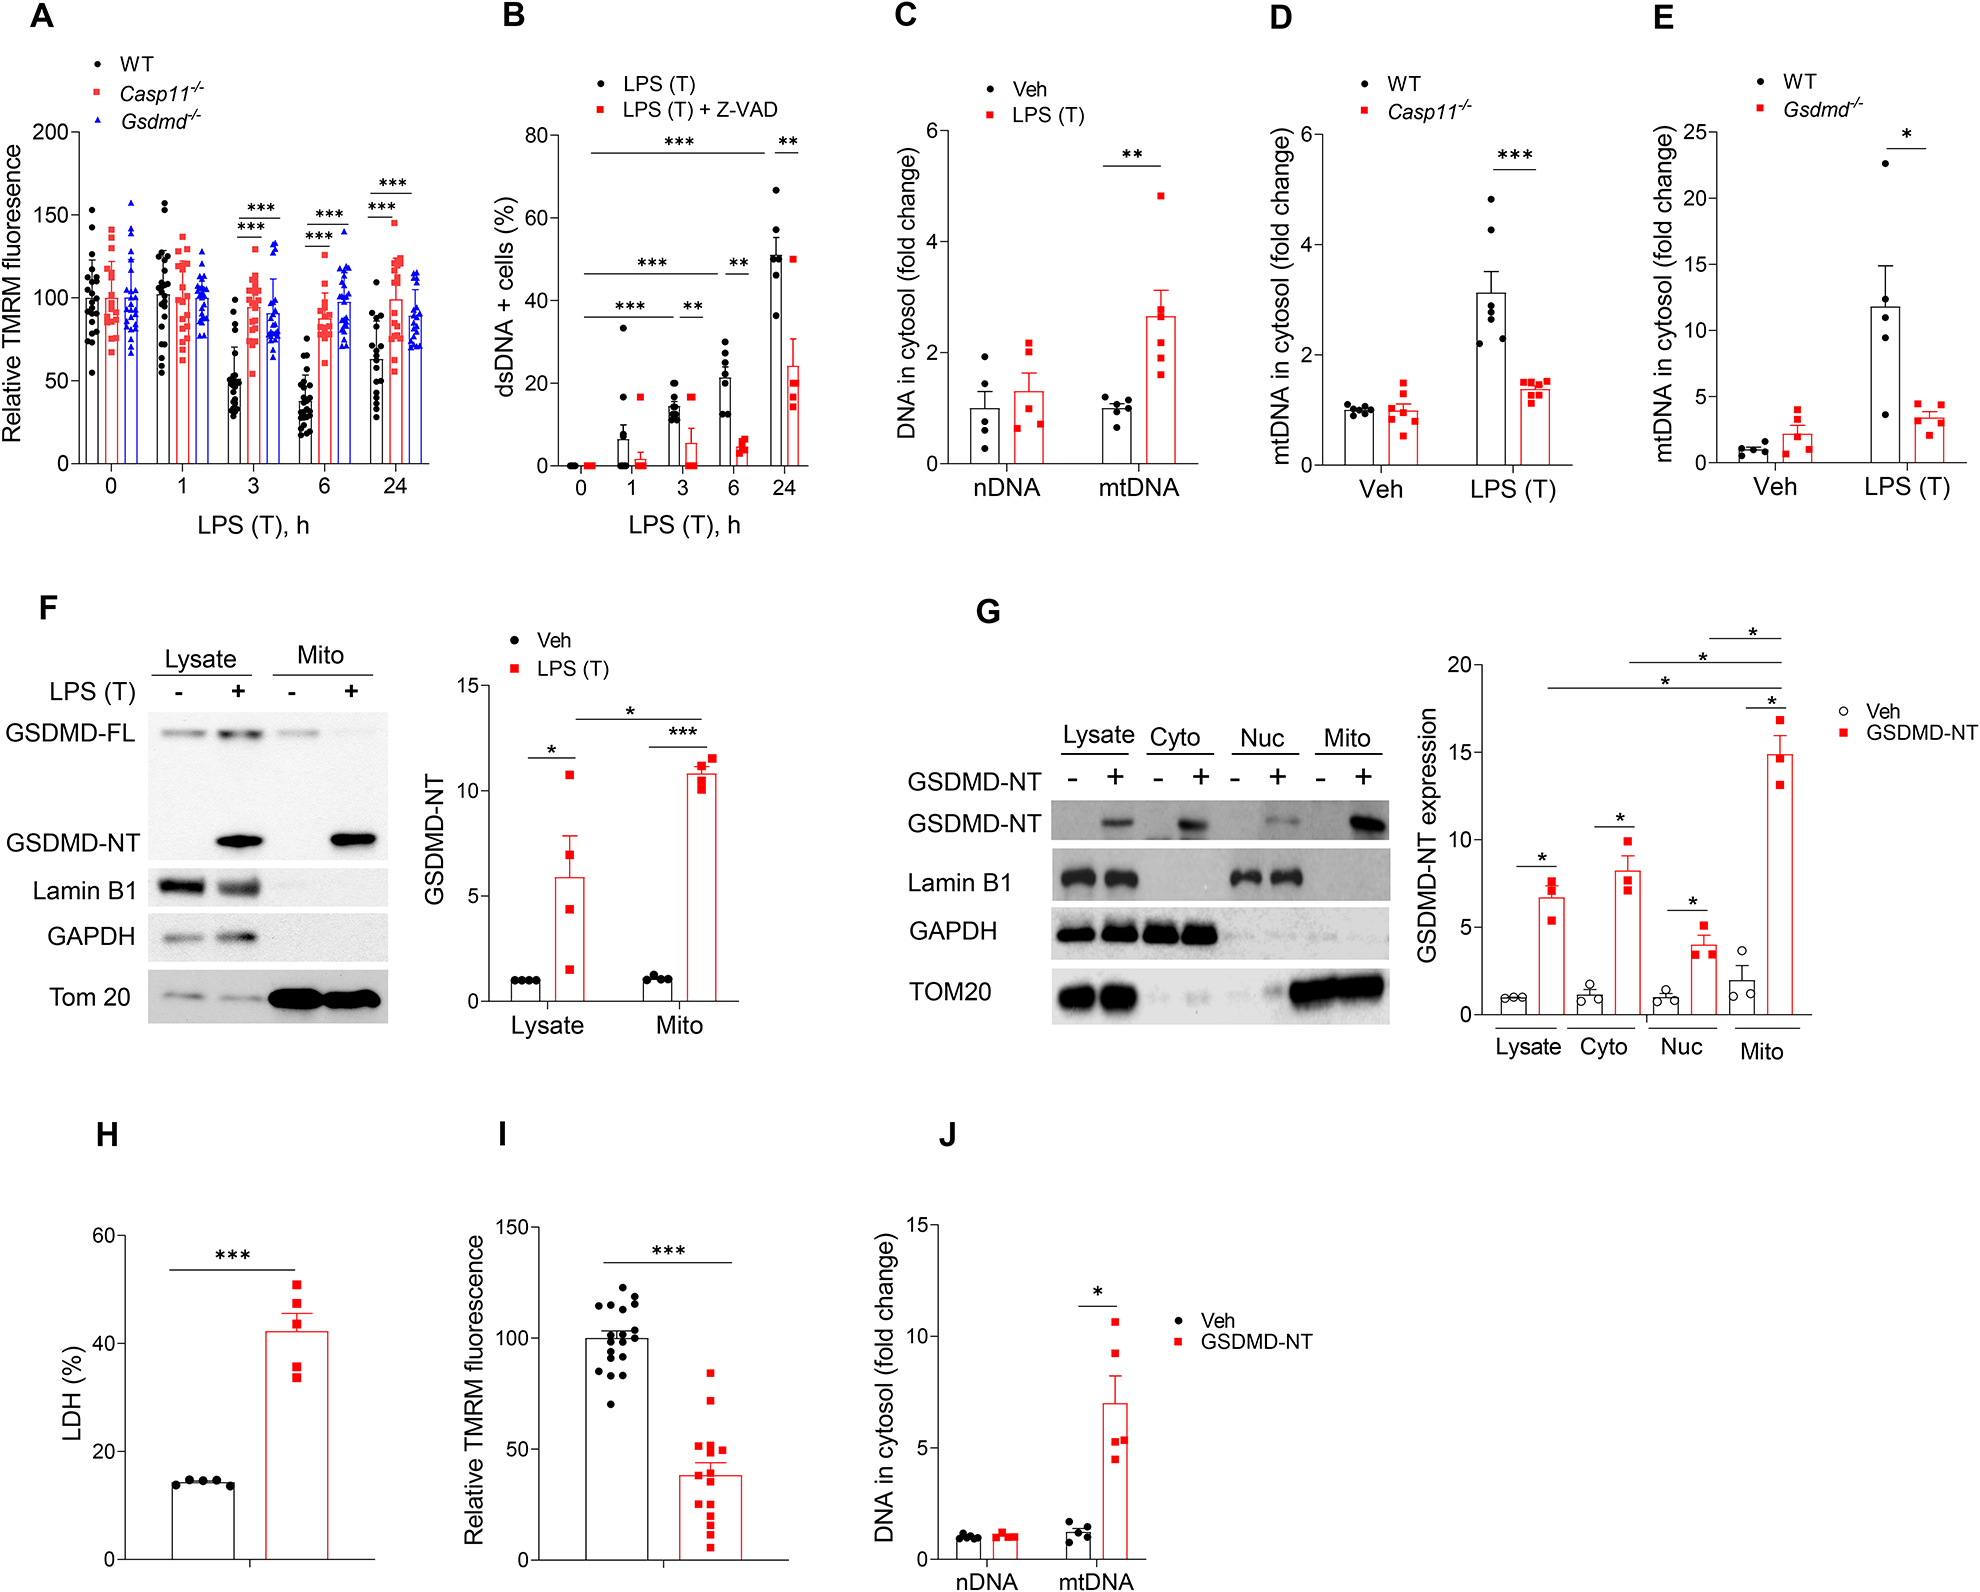
Fig. 1. Intracellular LPS induces mtDNA release through caspase11 and Gasdermin D.

(A) Quantification of MMP in mLMVECs from WT, Casp11−/− and GSDMD−/− mouse lungs transfected with LPS. mLMVECs were primed with LPS (LPS (E), 0.2 μg/ml, 3h), followed with medium change and transfection with or without LPS (LPS (T), 0.5 μg/ml, 0–24 h). Values are shown as mean ± SD; data were obtained from three independent experiments (n= 15–25). (B) Percentage of cells with cytosol dsDNA in LPS (T) treated hLMVECs were analyzed by staining dsDNA. hLMVECs were pretreated with (0, 50 μM, 30 min) Z-VAD-FMK and followed with priming with LPS (0.2 μg/ml, 3h) and treated with LPS (T) (0, 0.5 g/ml, 0–24h). Values are shown as mean ± SD; data were obtained from three independent experiments (n= 5–10). (C) RT-qPCR analysis of cytosolic nuclei DNA (nDNA) and mitochondrial DNA (mtDNA) in hLMVECs after LPS (T) (0.5 g/ml, 24h), n =5–6. (D & E) RT-qPCR quantification of cytosolic mtDNA in mLMVECs ((D) WT vs. Casp11−/−, n=7; (F) WT vs. GSDMD−/−, n=5; after LPS (T) (0, 0.5 g/ml, 24h). (F) LPS (T) induced endogenous GSDMD-NT formation and trans-localizes to mitochondrial membrane. Primed hLMVECs (LPS, 0.2 μg/ml, 3h) were transfected with LPS (0.5 μg/ml, 16h). The mitochondrial fractions were isolated using mitochondrial isolation kit, and the expression of protein were analyzed by immunoblotting, n = 4. (G-I) GSDMD-NT localizes to mitochondrial membrane, decreases MMP, induces cell pyroptosis and cytosolic release of mtDNA. Vehicle plasmid and the GSDMD-NT plasmid (3 μg/ml) were transfected into hLMVECs for 24h, the LDH released into the medium was assayed. The mitochondrial membrane potential was analyzed using the potentiometric dye TMRM, and the release of mtDNA into cytosolic fraction was analyzed by RT-qPCR. (G) Fractionation analysis of hLMVECs with or without overexpression of GSDMD-NT (24h), n = 3. (H) LDH release from hLMVECs with or without GSDMD-NT overexpression, n = 5. (I) TMRM staining (100 nM, 15 min) and analysis of hLMVECs with or without overexpression of GSDMD-NT. Quantification of MMP in hLMVECs with or without GSDMD-NT transfection (24h). Values are shown as mean ± SD, data were obtained from three independent experiments, n = 15–19. (J) RT-qPCR quantification of cytosolic nDNA and mtDNA from hLMVECs with or without GSDMD-NT overexpression, n = 4–6. * P < 0.05, * * P < 0.01, * * * P < 0.001, two-tailed t-test. Values are mean ± SD. Please also see Figure S1.
