Figure 7.

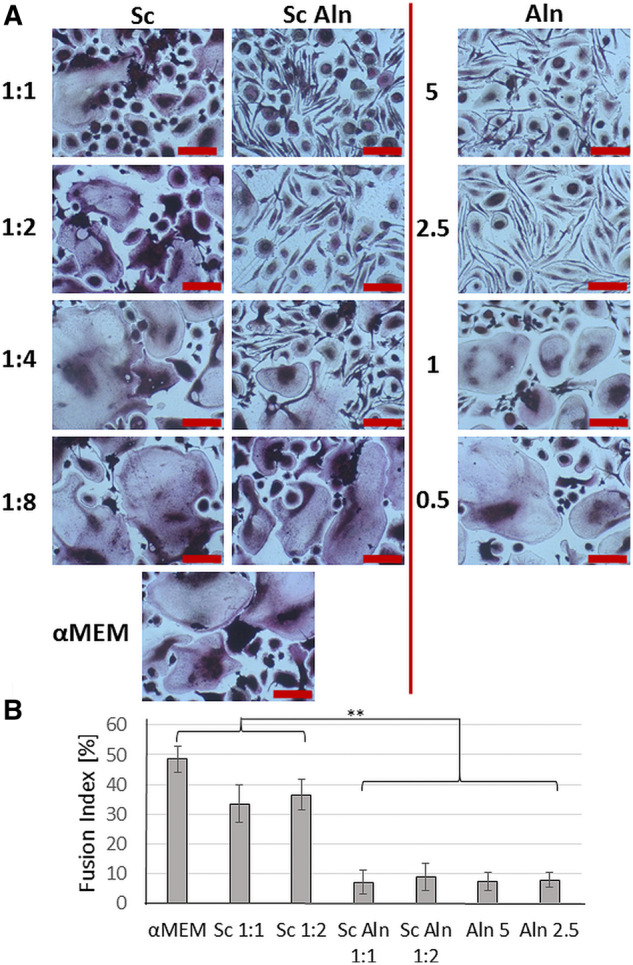
Osteoclast-like cell cultures visualized by TRAP staining (A) after 15 days in contact with extracts diluted in α-MEM by the factors 1:1 (undiluted), 1:2, 1:4 and 1:8 from TiO2 scaffolds (Sc, first column), TiO2 scaffolds decorated with Aln-loaded MPs attached with collagen (Sc Aln, second column). Additionally, results of cells cultured in Aln solutions (5, 2.5, 1 and 0.5 µg/ml Aln, last column) are shown. As a reference, cells cultured in α-MEM medium are presented (lowest panel on the left). All scale bars = 50 μm. Cell fusion index of osteoclast-like cultures (B) in contact with α-MEM and extracts from selected scaffolds: Sc (1:1, 1:2) and Sc Aln (1:1, 1:2) and in exposed to Aln solutions of 5, 2.5 µg/ml. Mean ± S.D. *P < 0.05, **P < 0.01.
