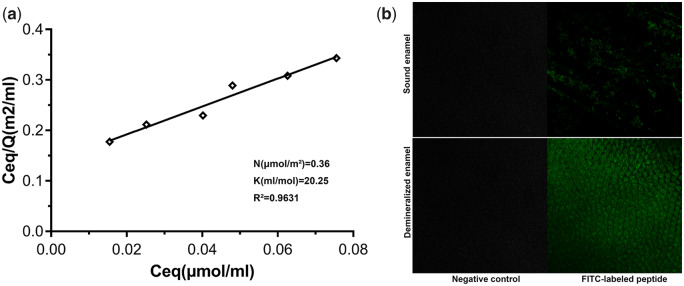
Figure 1.
(a) Linear adsorption isotherms of QP5. The maxim number of adsorption sites per unit of HA surface area (N) and the affinity of peptide molecules for HA adsorption sites (K) and were calculated. R2 is the correlation coefficient obtained for linear adsorption isotherms. (b) CLSM images of sound tooth enamel surface, non-treated demineralized tooth enamel sample surface, FITC-labelled QP5-treated normal tooth enamel surface and FITC-labelled QP5-treated demineralized tooth enamel surface

