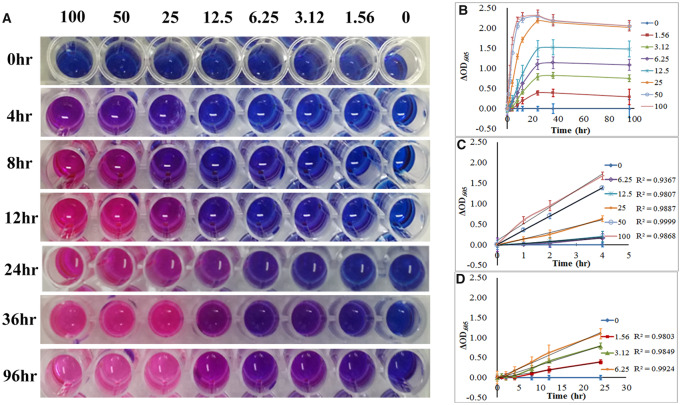
Figure 2.
Effects of cell concentration and resazurin incubation time on viable cell estimation. (A) Graph of color changes of resazurin at different time point. (B–D) Absorbance reduction of resazurin as a function of viable cell concentration of MC3T3-E1 and incubation time. (B) The cell concentration ranged from 0 to 100 × 104 cells/well, (C) the cell concentration ranged from 6.25 to 100 × 104 cells/well and (D) the cell concentration ranged from 1.56 to 6.25 × 10⁴ cells/well

