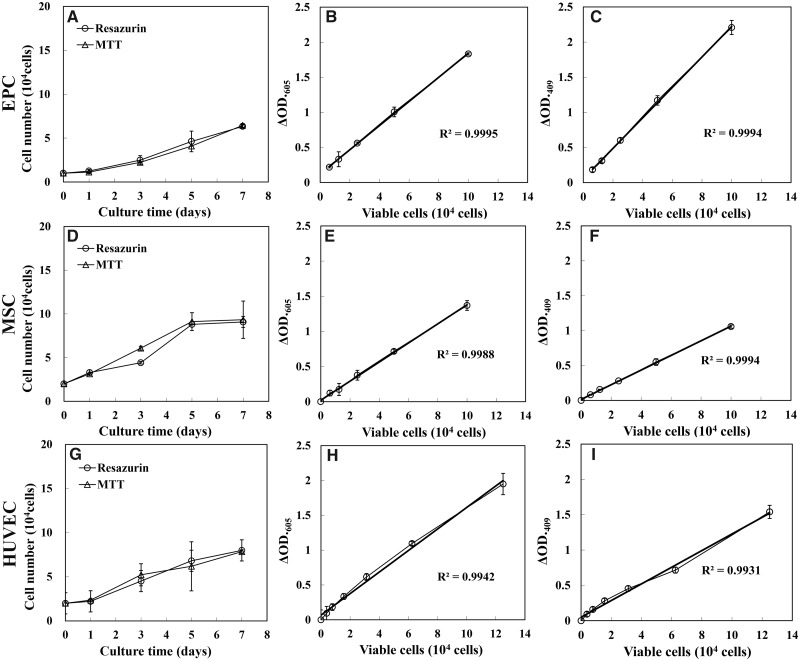
Figure 9.
Effects of repeated viable cell estimation on growth of EPC, MSC and HUVEC cultured on 24-well plate. Growth curves of EPC (A), MSC (D) and HUVEC (G), which were cultured in 24-well plate. The control group and the test group were monitored by MTT assay and resazurin assay, respectively. Each point was the mean of absorbance readings of four scaffolds. The representative standard curves of resazurin assay of EPC (B), MSC (E) and HUVEC (H). The representative standard curves of MTT assay of EPC (C), MSC (F) and HUVEC (I)

