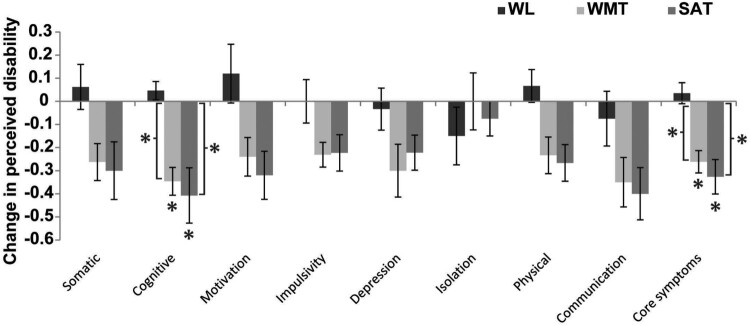
Figure 4.
Change in self-reported functioning as measured by the EBIQ from pre-test to post-test. Formal statistical testing was only completed for EBIQ cognitive and EBIQ core symptoms. For these measures, an * above the bar denotes that that group is a significant (p < .05) predictor of the post-test score, whilst an * to the left of a bar indicates a significant (p < .05) change in test performance between pre and post-test, as measured by paired sample t-tests. Please note formal to reduce the number of test carried out, formal statistical analyses were only carried out on EBIQ cognitive and EBIQ core sub-scales, the significance of the other subscales has not been tested.

