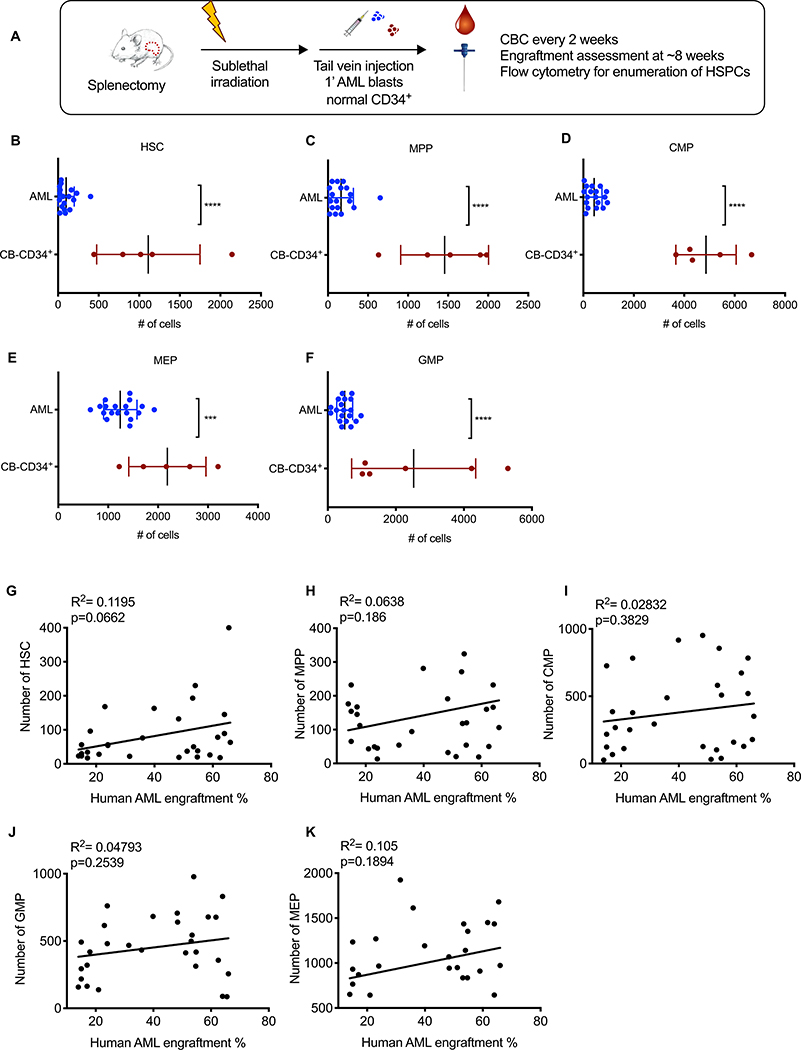
Fig. 3. Normal mouse HSPCs are depleted in the presence of human AML.
(A) Schematic of experimental procedure. Absolute numbers of (B) HSC (AML 99.9±23.3 vs CB 1112±285; p<0.0001), (C) MPP (AML 163±36.3 vs CB 1456±245; p<0.0001), (D) CMP (AML 427±74.1 vs CB 4864±534; p<0.0001), (E) MEP (AML 1241±78.8 vs CB 2186±346; p=0.0005), and (F) GMP (AML 498±53.7 vs CB 2525±744; p<0.0001) in NSGspln--PDX (n=25, engrafted with the same AML samples as in in Fig. 2D, E, absolute numbers represent total numbers per mouse) and NSGspln--CB-CD34+ (n=5, engrafted with the same CB samples as in Fig. 2D, F) mice 8 weeks after transplantation. Pearson’s Correlation between absolute numbers of (G) HSCs, (H) MPP, (I) CMP, (J) GMP, (K) MEPs and BM disease burden as indicated by percent AML engraftment in the BM.

