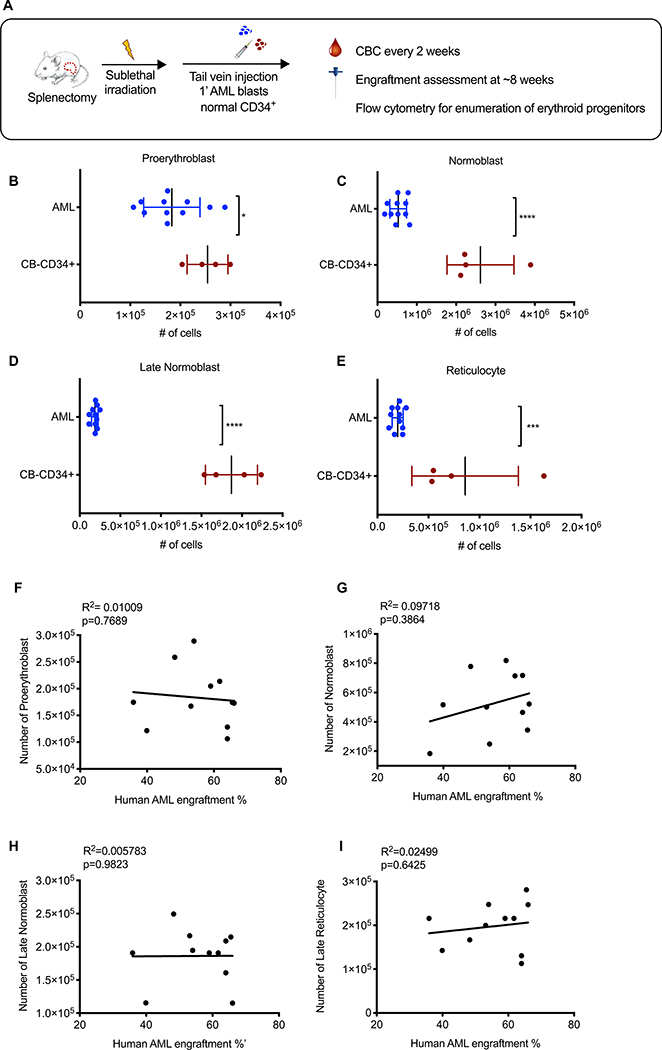
Fig. 4. Human AML blasts impart an erythroid differentiation blockade in vivo.
(A) Schematic of experimental procedure. Absolute numbers of mouse (B) proerythroblasts (AML 1.8×10⁵ ± 1.7 × 10⁴ vs CB 2.5×10⁵ ± 2.0×10⁴; p=0.034), (C) normoblasts (AML 5.4×10⁵ ± 6.4×10⁴ vs CB 2.6×10⁶ ±4.3×10⁵; p<0.0001), (D) late normoblasts (AML 1.86×10⁵ ±1.3×10⁴ vs CB 1.9×10⁶ ± 1.6×10⁵; p<0.0001), and (E) reticulocytes (AML 2.0×10⁵ ± 1.6×10⁴ vs CB 8.6×10⁵ ± 2.6×10⁵; p=0.0007) in the BM of NSGspln--PDX (engrafted with SU540 (n=6) and SU575 (n=5)) compared to NSGspln--CB-CD34+ mice (n=4). Absolute numbers represent total numbers per mouse. Pearson’s correlation between absolute numbers of (F) proerythroblasts, (G) normoblasts, (H) late normoblasts, (I) reticulocytes and human AML BM engraftment. All R2 = Pearson correlation determination.

