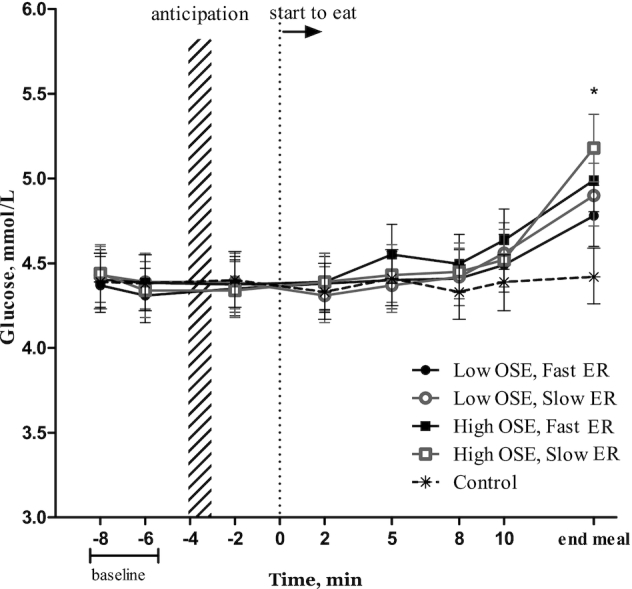
FIGURE 6.

Glucose (mmol/L) per time point for each condition (n = 20). Values are means ± 95% CIs, ANOVA within subject (repeated measures). *“End meal” of each study treatment was significantly different to all other time points and compared with the control condition (P < 0.05, Tukey's post hoc test). ER, eating rate; OSE, oro-sensory exposure.
