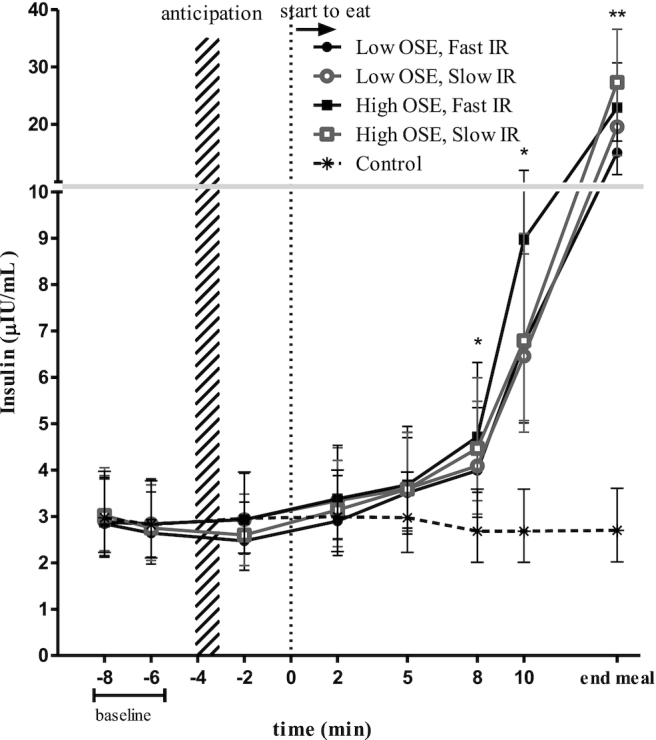
FIGURE 7.

Insulin (μIU/mL) concentrations per time point for each study condition (n = 20). Values are geometric means ± 95% CIs, ANOVA within subject (repeated measures) *Time points 8 min, 10 min, and end of meal significantly differed from the control condition.. **Significant difference between the low-OSE, fast-ER and high-OSE, slow-ER conditions (Tukey's post hoc test, P < 0.05). ER, eating rate; OSE, oro-sensory exposure.
