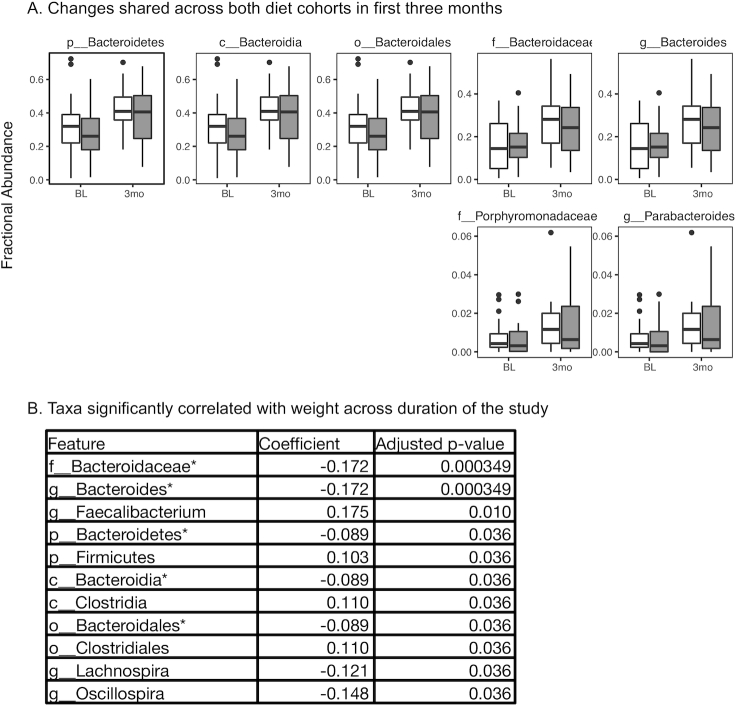
FIGURE 4.
Changes observed in both diets correlate with weight. A: Compositional changes at 3-mo shared between the low-carbohydrate diet and low-fat diet. Abundances of taxa that significantly changed between the baseline sample and 3-mo sample on both diets are shown (all participants plotted). Significance calculated as adjusted q value <0.05 (SAM 2-class paired). White, healthy low-carbohydrate; gray, healthy low-fat. All taxa shown share the same phylogeny (Bacteroidetes phylum). Diet-specific changes are shown in Figure 3. “x_” indicates phylogenetic level where x = p, phylum; c, class; o, order; f, family; g, genus. Number of samples used was based on the lowest number of samples available in low-fat or low-carbohydrate per time point: BL vs. 3-mo: n = 22/diet; BL vs. 6-mo: n = 18/diet; BL vs. 9-mo: n = 23/diet; BL vs. 12-mo: n = 21/diet. B: Modeling results of taxonomic abundance and weight. Linear mixed-effects models were optimized per taxa, with taxa significantly associated with weight listed in the table (adjusted P value <0.05, Benjamini-Hochberg). Taxa were tested whose abundance was >1% in ≥5% of the samples. *Denotes taxa that were identified in Figure 4A. Low-fat: n = 24, low-carbohydrate: n = 25. BL, baseline; SAM, significance analysis of microarrays.

