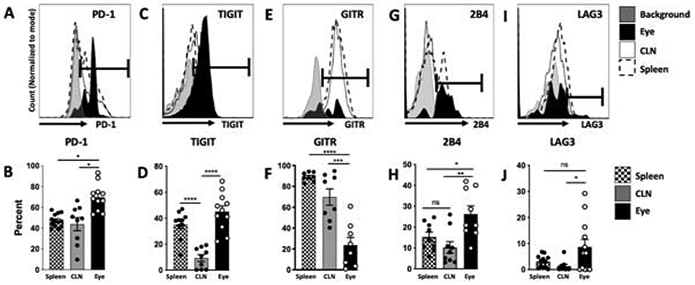
Figure 3. TIGIT, PD-1, LAG 3, and 2B4 are expressed on ocular post-EAU Treg cells.

Post-EAU lymphocytes from the spleen, cervical lymph node (CLN), and the eyes were reactivated with IRBPp (1-20) for 48 hrs and analyzed with flow cytometry. The expression of PD-1, TIGIT, GITR, 2B4, and LAG3 is shown in representative histograms of CD4+GFP+Tom+ gated cells from the eye, CLN or spleen (A). Bar graphs show the mean ± SEM of the percentages of the indicated marker from the eye, CLN or spleen for all experiments (B). Data shown is from 3-4 independent experiments with 2-5 mice per experiment, where each symbol on the bar graph represents one mouse. Summary data were analyzed by one-way ANOVA, with Tukey multiple-comparison test, * p<0.05, **p<0.01, ***p<0.001, ****p<0.0001, n.s. not significant.
