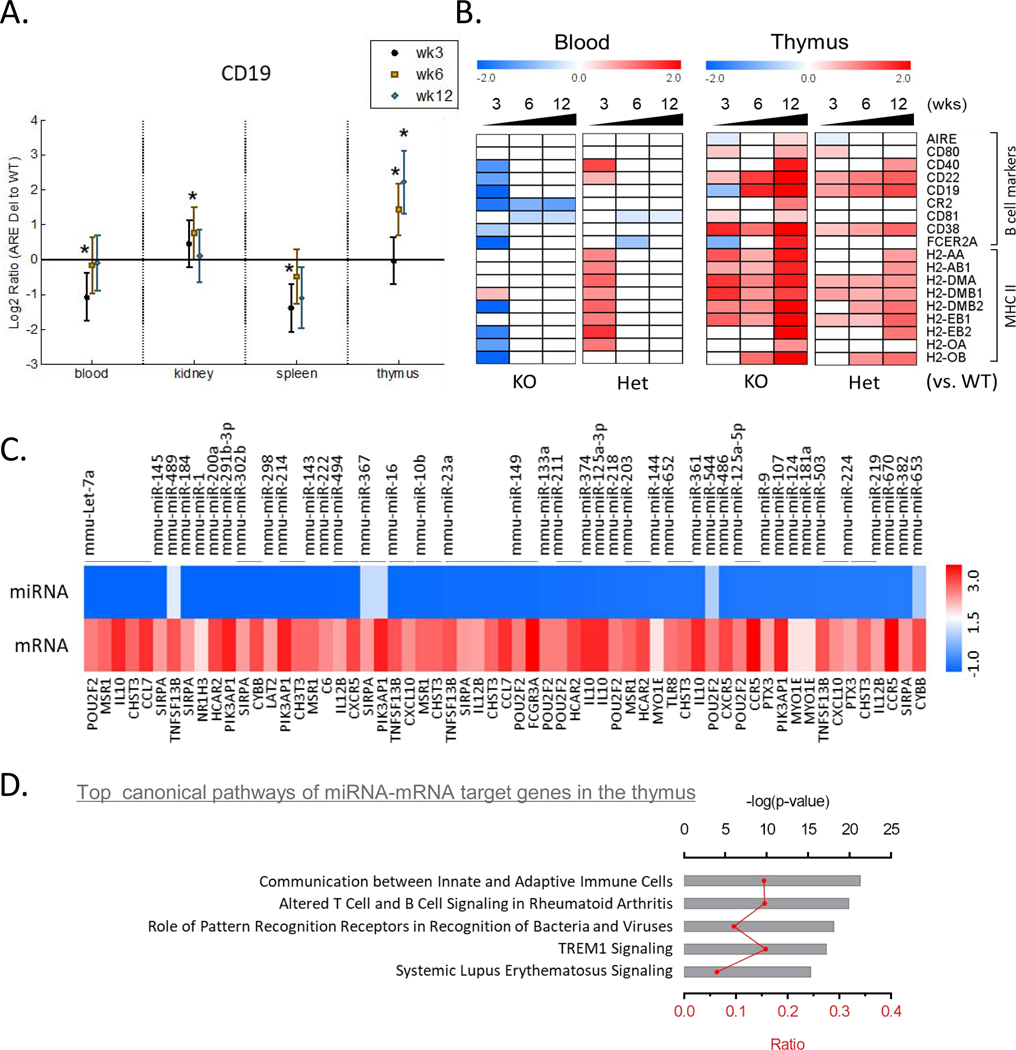
Figure 6.
Correlation between early loss of peripheral B cells and late increase of thymic B cells. (A) Gene expression levels of CD19 comparing homozygous ARE Del mice to control littermates in the PBMCs, kidney, spleen, and thymus at 3, 6, and 12 weeks old. Statistical analysis is performed by t-test, *P<0.05. (B) Heat map of genes for B cell markers and MHC II molecules in PBMCs and thymus according to ages in female homozygous and heterozygous ARE-Del mice compared to control littermates. (C) Heat map of miRNA-mRNA target genes in the thymus. Significantly changed microRNAs in the thymus were selected by p-value (p<0.05) and fold changes (fold change threshold ±1.5). Target genes (21 genes without overlapping) were identified by integration of miRNAs and mRNAs, which significantly changed in the thymus at 12 weeks old, using the IPA’s miRNA target filter. (D) Top cannonical pathways of significantly chanted miRNA-mRNA target genes were analyzed by -log(p-value) and ratio according to IPA. Red shading indicates an increase, green shading indicates a decrease.

