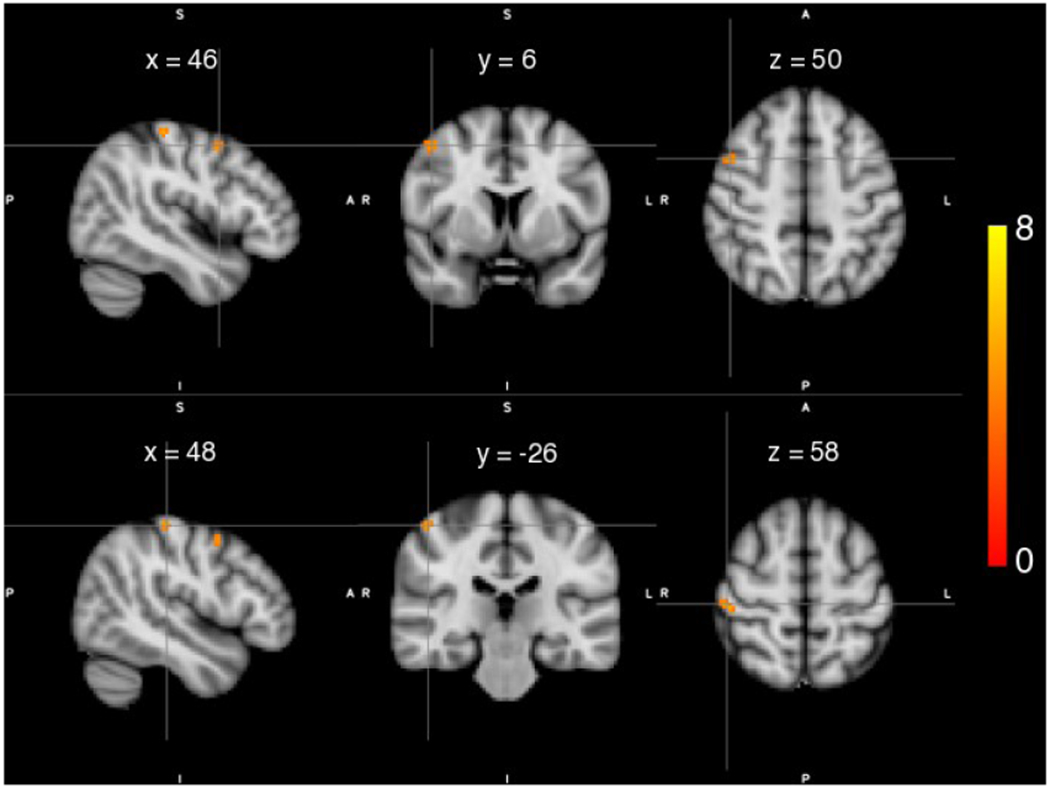
Figure 2.

Statistical maps of gray matter (GM) density differences for individuals with stroke compared to healthy controls. Significantly higher GM density was observed in ipsilateral premotor cortex (Top) and ipsilateral primary somatosensory cortex (Bottom) in individuals with stroke compared to controls. Color maps indicate the thresholded t values at each voxel. A statistical threshold was set equivalent to p < 0.05 FWE.\
