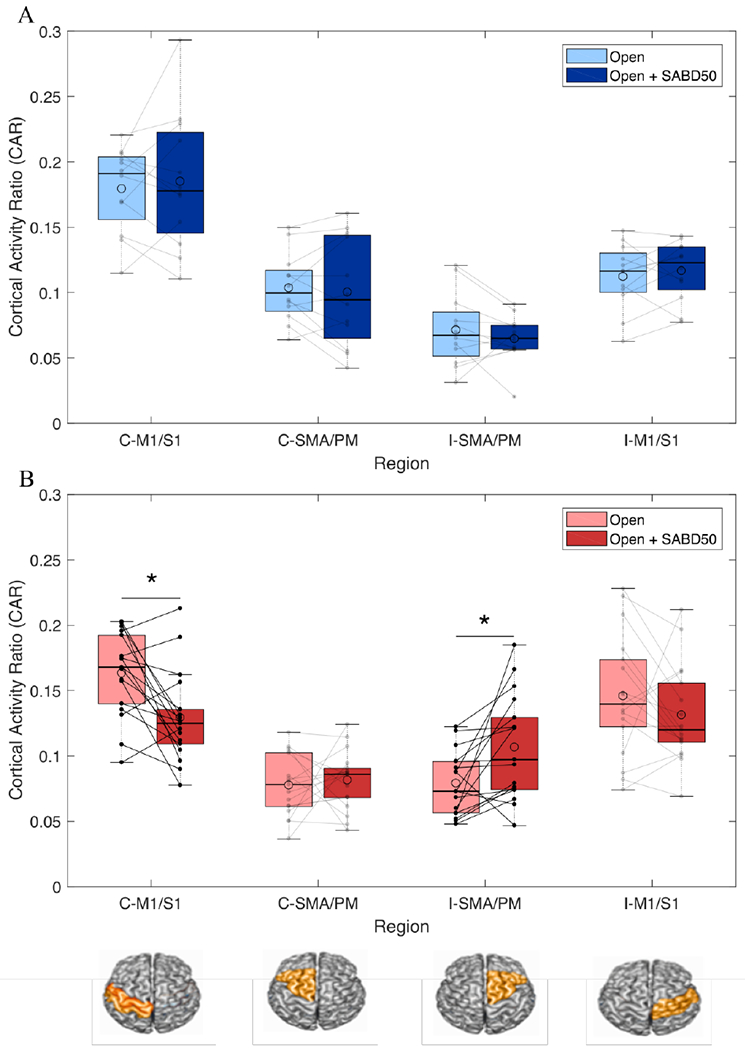
Figure 5.

Cortical regions driving SABD-dependent reliance on the ipsilateral hemisphere. (A) Boxplots with individual data overlaid depicting cortical activity ratio (CAR) during hand opening (light blue) and hand opening while lifting against 50% max shoulder abduction (dark blue) across the 4 regions of interest in healthy controls. No changes in CAR are observed in any of the regions between the two tasks. (B) Boxplots with individual data overlaid depicting CAR during hand opening (light red) and hand opening while lifting against 50% max shoulder abduction (dark red) across the 4 regions of interest in individuals with stroke. Individuals demonstrated a decrease in activity in contralateral (ipsilesional) primary sensorimotor cortex (M1/S1) and an increase in ipsilateral (contralesional) secondary motor areas (SMA/PM) with the addition of SABD. ROIs are depicted below the figure. The median is shown by the horizontal black line and the mean is illustrated by the large open circle. C = contralateral, I = ipsilateral. * p < 0.05.
