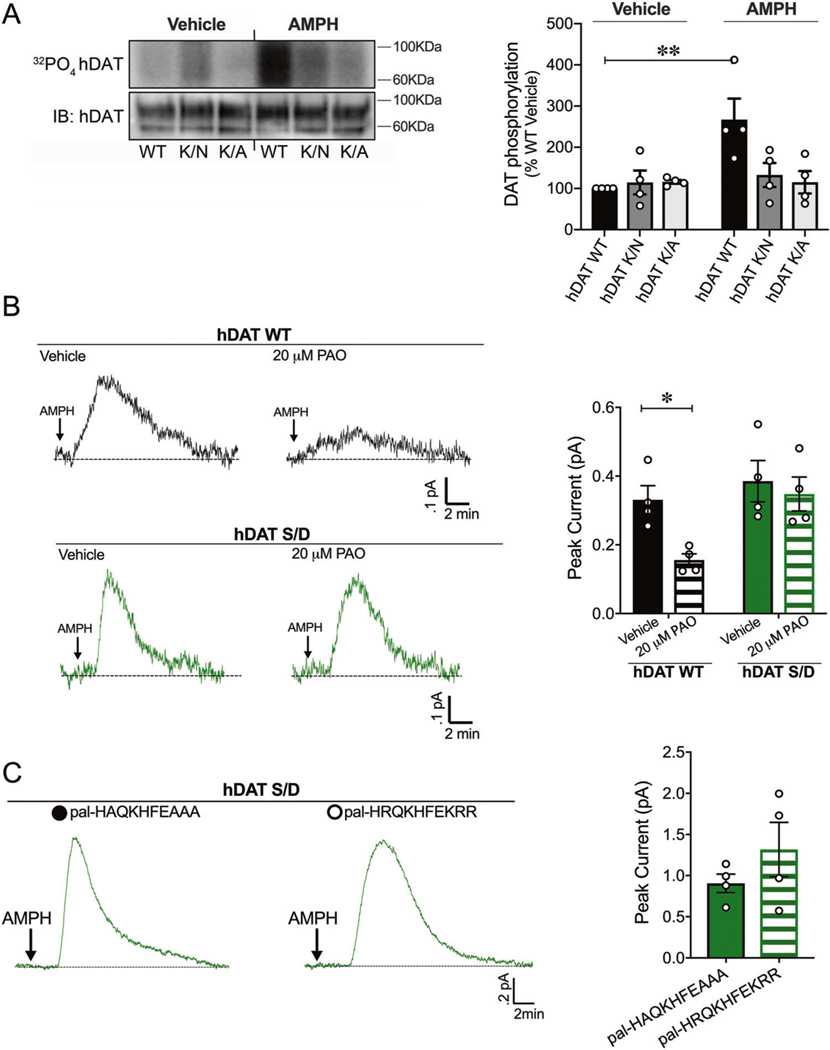
Fig. 1. PIP2/N-terminus interactions regulate DAT phosphorylation, a posttranslational modification that supports PIP2 independent DA efflux.
a hDAT WT, hDAT K/N, or hDAT K/A cells were labeled with 32P prior to vehicle or AMPH (10 μM, 30 min) incubation. Equal amounts of DAT determined by immunoblotting were immunoprecipitated and subjected to SDS-PAGE/auto-radiography. Left: representative autoradiographs showing hDAT phosphorylation after vehicle or AMPH exposure, along with respective immunoblots of total hDAT. Right: DAT phosphorylation is quantified as 32P labeling normalized to basal hDAT 32P labeling. hDAT WT phosphorylation increased post-AMPH treatment relative to vehicle (n = 4; F(2, 18) = 5.05, p = 0.002). In hDAT K/N and hDAT K/A cells, displayed no changes in DAT phosphorylation in response to AMPH compared with vehicle (p > .05). b Left: representative traces of amperometric currents recorded from hDAT WT (black traces) and hDAT S/D (green traces) preincubated in either vehicle or PAO (20 μM, 10 min) and subsequently treated with AMPH (10 μM; indicated by arrow). Right: quantitation of mean peak current amplitudes in hDAT WT and hDAT S/D cells. Preincubation with PAO significantly decreased DA efflux in hDAT WT cells (0.33 ± 0.04 pA) with respect to vehicle (0.16 ± 0.02 pA; p = 0.03; n = 4), but not in hDAT S/D cells (vehicle: 0.38 ± 0.06 pA, PAO: 0.35 ± 0.05 pA; p > 0.05; n = 4). c Representative traces from hDAT S/D cells after whole-cell patch delivery of control peptide (3 μM, pal-HAQKHFEAAA) or PIP2 sequestering peptide (3 μM, pal-HRQKHFEKRR) to the cytoplasm of the cell prior (10 min) to the application of AMPH (10 μM, indicated by arrow). Delivery of control or PIP2 sequestering peptides resulted in comparable peak currents in response to AMPH (n = 4; p > 0.05). Data are presented as mean ± SEM. Two-way ANOVA with Bonferroni’s multiple comparison test: a, b; Student’s t test: c.

