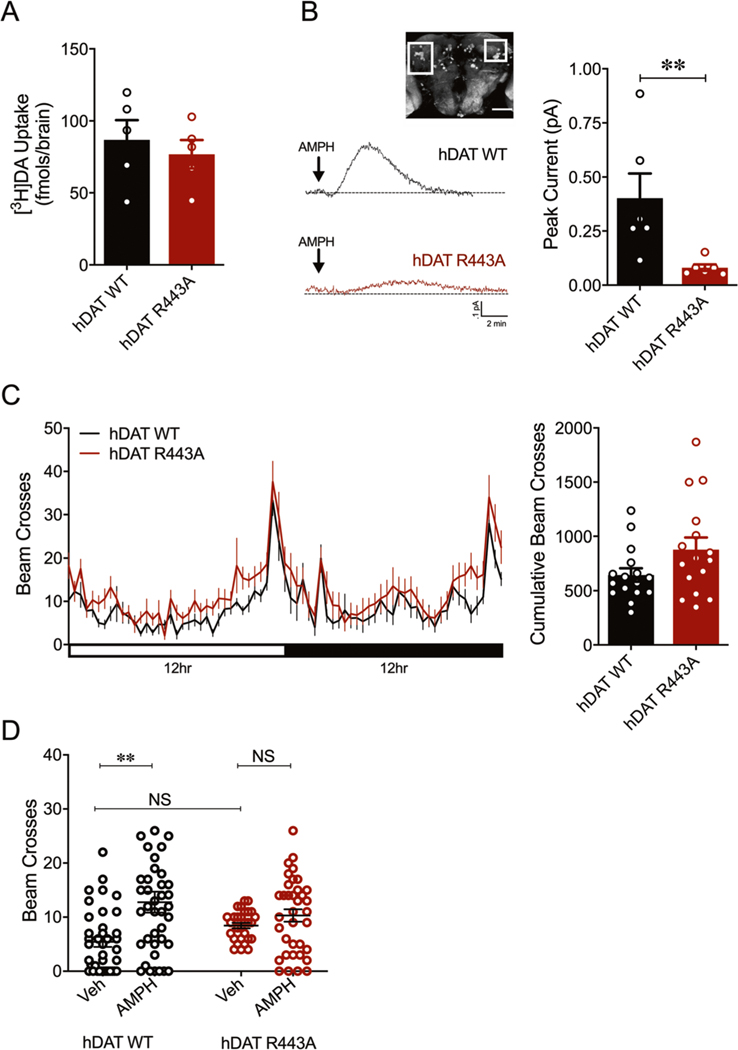
Fig. 4. hDAT R443A limits central and behavioral responses to AMPH.
a hDAT WT or hDAT R443A was expressed in DA neurons in a dDAT KO (fmn) background. 3[H]DA uptake (200 nM, 10 min) was measured in adult isolated Drosophila brain (n = 5). DA uptake measured in hDAT WT flies (86.9 ± 13.7 fmol/brain) was comparable to that measured in hDAT R443A flies (76.9 ± 9.9 fmol/brain; p > 0.05). b Left: representative traces of amperometric currents recorded from a dense cluster of DA neurons (PPL1, boxed in inset) in response to AMPH application (20 μM; indicated by arrow) in hDAT WT (black trace) and hDAT R443A (red trace) brains. Right: quantitation of peak current amplitudes. hDAT WT flies displayed higher peak currents (0.40 ± 0.11 pA) than hDAT R443A flies (0.08 ± 0.02 pA; n = 6; p = 0.004). c Left: locomotor activity was assayed over a 24-h period including both the light (horizonal white bar) and dark (horizontal black bar) cycle. Circadian activity curves show average beam crosses (20-min interval) during the 24-h period for hDAT WT (black line) and hDAT R443A (red line) Drosophila. Right: cumulative beam crosses were not significantly different for hDAT WT (654 ± 61) versus hDAT R443A Drosophila (879 ± 110; p > 0.05; n = 16). d Locomotor activity was measured after a 30-min exposure to vehicle or 1 mM AMPH. The total beam crosses increase in the AMPH (12.8 ± 1.9; n = 39) compared with vehicle group (5.4 ± 0.9; n = 38) of hDAT WT Drosophila (F(1,138) = 11.83, p = 0.0005). In hDAT R443A Drosophila, AMPH (10.3 ± 1.2; n = 36; p > 0.05) did not increase the total beam crosses compared with vehicle group (8.5 ± 0.5; n = 29) and with respect to hDAT WT vehicle group (p > 0.05). Data are presented as mean ± SEM. Student’s t test: a, c; Mann–Whitney test: b; two-way ANOVA with Bonferroni’s multiple comparison test: d.

