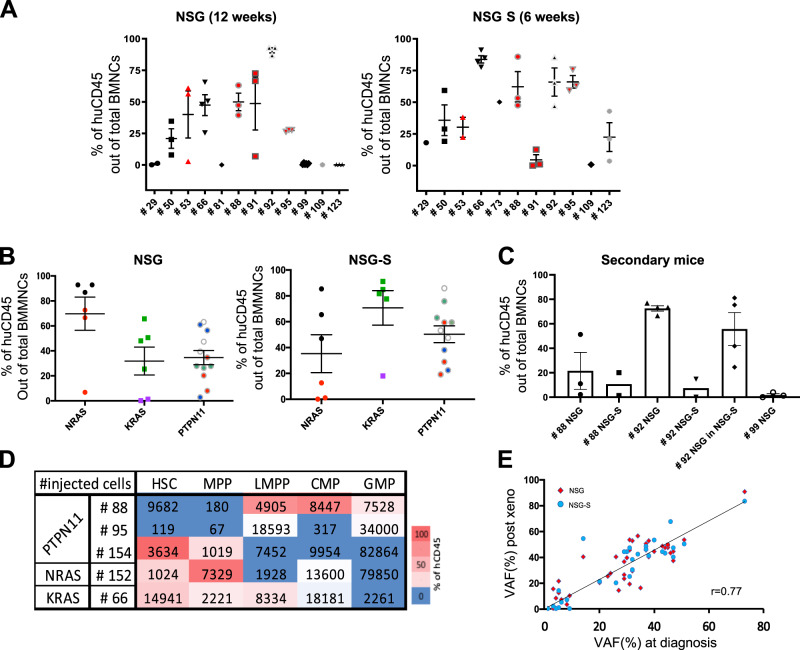
Fig. 3.
PDX models accurately capture the features and clonal diversity of the disease and allow to characterize the JMML-PC. a Percentage of human CD45 out of total BMNCs present in the mouse BM at termination, in NSG (n = 12 patients, n = 35 mice), and NSG-S (n = 11 patients, n = 27 mice). In each panel, red symbols indicate JMML that are CD90high (#53, #88, #91, and #95). b The levels of human engraftment are displayed per mutated gene between the two mice models. Matching shapes and colors represent the same patient between the two models. c The level of human CD45 engraftment out of total nucleated cells in secondary recipients (10 NSG, 8 NSG-S) for three patients (#88, #92, and #99). Samples harvested from primary NSG mice were injected into NSG secondary recipient and/or primary NSG-S into secondary NSG-S. For patient #92, cells harvested from the NSG primary mouse were injected into either NSG or NSG-S (see also Supplementary Table S3). d Heat map representation of the level of engraftment obtained after injection of the different JMML hematopoietic fractions (HSC, MPP, LMPP, CMP, GMP) of five patients with JMML (#88, #95, #154, #152, and #66). The number of cells injected per patient and per fraction is displayed for each fraction. e Correlation of variant allele frequencies (VAF) obtained from the cells post xenotransplant compared with the native JMML cells from the patient at diagnostic. Each dot representing one mutation (red dots: NSG; blue dots: NSG-S). See also Supplementary Fig. S3

