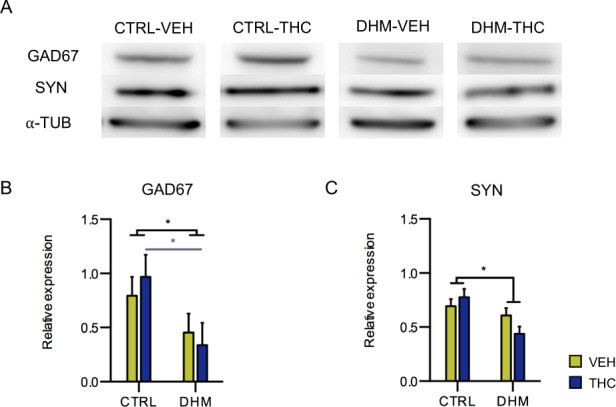
Fig. 2. Protein expression studies in the mPFC.

Western blot analysis of glutamic acid decarboxylase, 67 kDa isoform (GAD67), synaptophysin (SYN) and α-tubulin (α-TUB) (a). Optical density data analyses show a decrease in the expression of GAD67 (b) and SYN (c) in the DHM model, after two-way ANOVA test. Black asterisks indicate main effects and gray symbols and lines in graphs represent statistically significant differences among groups after post hoc analysis. p < 0.05 (*). Bars represent the mean ± S.E.M. n = 8 animals/group.
