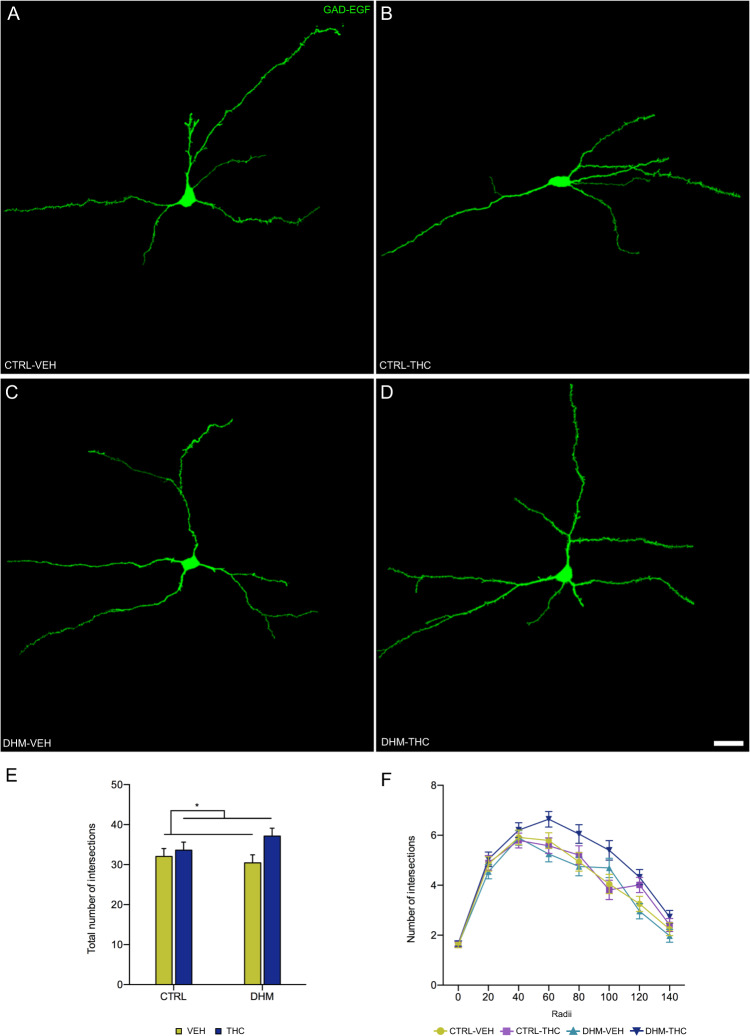
Fig. 3. Dendritic arborization in interneurons of the prefrontal cortex.
a–d Representative images of GAD-EGFP-expressing interneurons showing the dendritic arbor in the four experimental conditions. e Graph showing the number of total intersections. f Graph showing the number of intersections each 20 micron. Black asterisk in E represents statistically significant effects of THC administration after two-way ANOVA analysis. p < 0.05 (*). Bars represent the mean ± S.E.M. Scale bar: 25 μm. n = 6 animals/group.

