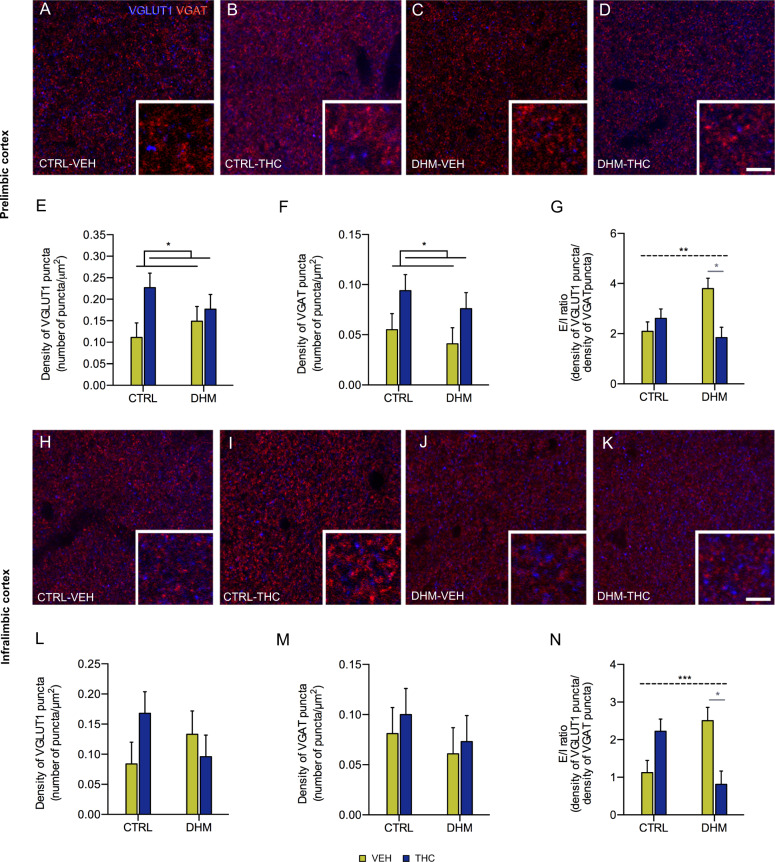
Fig. 4. Analysis of markers of excitatory and inhibitory neurotransmission in prelimbic and infralimbic cortices.
a–d Representative confocal images of excitatory (red, VGLUT1) and inhibitory (blue, VGAT) puncta in the neuropil of prelimbic cortex of CTRL and DHM animals after administration (VEH or THC). Scale bar: 10 and 3.3 μm for the detail. Graphs representing the density of VGLUT1 (e) and VGAT (f) immunoreactive puncta, and the E/I ratio [number of VGLUT1+ puncta/μm2]/[number of VGAT+ puncta/μm2] (g). e, f graphs show differences in VGLUT and VGAT expression due to THC administration after two-way ANOVA analysis. Horizontal lines in G represent interaction (black, dashed) after two-way ANOVA. Gray symbols and lines in graphs represent statistically significant differences among groups after post hoc. h–k Representative confocal images of excitatory (red, VGLUT1) and inhibitory (blue, VGAT) puncta in the neuropil of Infralimbic cortex of CTRL and DHM animals after administration (VEH or THC). Scale bar: 10 μm and 3.3 μm for the detail. Graphs representing the density of VGLUT1 (l) and VGAT (m) immunoreactive puncta, and the E/I ratio (n). Graphs show differences in the E/I ratio due to the interaction between model and administration after two-way ANOVA analysis p < 0.05 (*), p < 0.01 (**), p < 0.001 (***). Bars represent the mean ± S.E.M. n = 6 animals/group.

