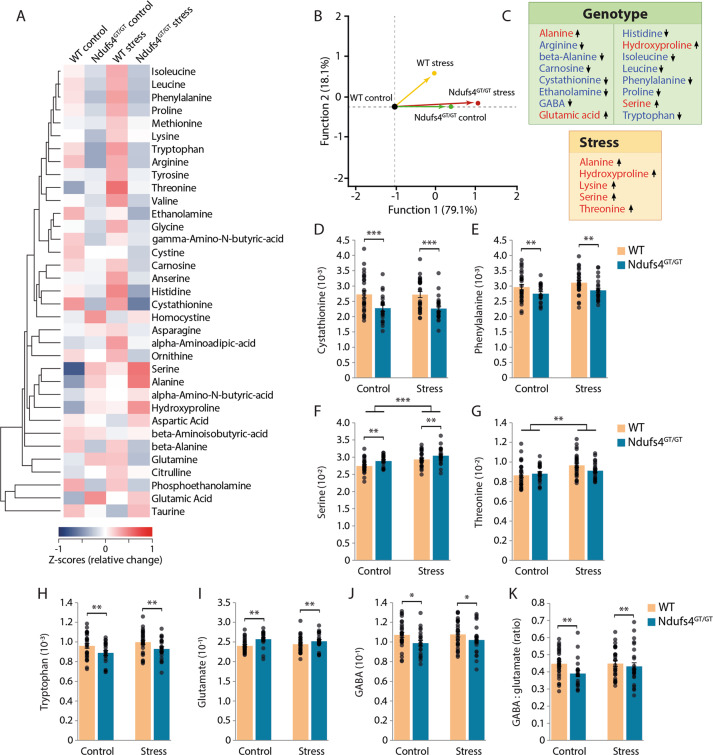
Fig. 4. Ndufs4GT/GT mice and chronically stressed mice show an altered metabolic rewiring.
a Hierarchical clustering heat map of normalized (z-score) levels for all measured amino acid (AA) metabolites. The dendrogram indicates the degree of correlation between each of the metabolites across all four groups. b Stepwise linear discriminant analysis of all AA metabolites indicated that the AA profile discriminated the Ndufs4GT/GT mice from WTs, as well as control from stress mice. c A highlight of the AA metabolites that were found to be statistically different between genotypes (top) or chronic stress condition (bottom). Arrows indicate the direction of the change compared to WT and control. d–g The four metabolites selected by the stepwise analysis as major contributing factors discrimination in the LDA analysis; cystathionine, phenylalanine, serine, and threonine, respectively. h Relative tryptophan, (i) glutamate, and (j) gamma-aminobutyric acid (GABA) levels across all four groups. k Relative GABA to glutamate ratio. Data were normalized to total AA concentration and show average ±SEM, with each black dot representing the result of an individual animal. *p < 0.05, **p < 0.01, and ***p < 0.001.

