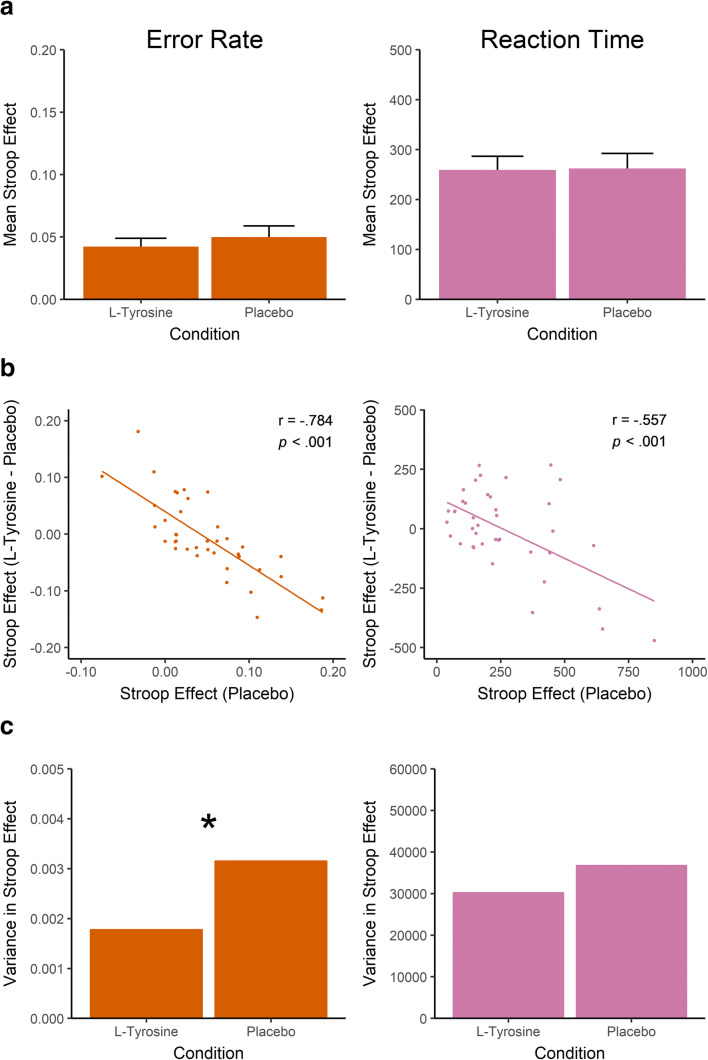
Fig. 3.
Results from the Stroop task. (a) Bar graphs indicating the mean congruency effect in the L-tyrosine and placebo conditions, including standard error of the mean. (b) Pearson r correlations of placebo performance and the L-tyrosine minus placebo performance. On the x-axis, higher scores indicate larger congruency effects. On the y-axis, positive scores indicate increased congruency effects on L-tyrosine whereas negative scores indicate reduced congruency effects. (c) Between-subject variance of the congruency effect in the L-tyrosine and placebo conditions. *p < 0.05

