

Abstract
Genetic assessment of rice landraces is important for germplasm evaluation and genetic resource utilization. Rice landraces in peninsular Thailand have adapted to unique environmental stresses over time and have great significance as a genetic resource for crop improvement. In this study, rice landraces derived from rice research centers and farmers from different areas of peninsular Thailand were genetically assessed using 16 polymorphic InDel markers from putative stress-related genes. A total of 36 alleles were obtained. The average PIC value was 0.27/marker. The FST varied from 0.46 to 1.00. Genetic diversity was observed both within and between populations. AMOVA indicated that genetic variations occurred mainly between populations (70%) rather than within populations (30%). The dendrogram, population structure, and PCoA scatter plot clearly demonstrated the differentiation of the two major groups, i.e., landraces from upland and lowland rice ecosystems. The unique alleles of Indel1922, -2543, -6746, -7447 and -8538, which lie in genes encoding putative WAX2, heavy metal-associated domain-containing protein, GA20ox2, PTF1, and PLETHORA2, respectively, were only found in rice from upland ecosystems. Putative WAX2, GA20ox2, and PLETHORA2 are likely related to drought and salt stress. Our findings demonstrate the diversity of landraces in peninsular Thailand. The preservation of these landraces should be facilitated with effective markers to maintain all variant alleles and to protect the genetic diversity. Indel1922, -2543, -6746, -7447 and -8538 have the potential to differentiate upland rice from lowland rice. Furthermore, Indel1922, -6746 and -8538 might be effective markers for drought and salt tolerance.
Electronic supplementary material
The online version of this article (10.1007/s12298-020-00816-z) contains supplementary material, which is available to authorized users.
Keywords: Genetic differentiation, Genetic resources, Indigenous rice, Lowland rice, Natural allelic variation, Upland rice
Introduction
Rice (Oryza sativa L.) is one of the most important food crops and a model plant for genomic research. For future world food security, a sustainable increase in rice production is required via high-yielding cultivars with resistance to stresses (Li and Zhang 2013). In the post-genomics era, the rice genome has been completely sequenced (Sasaki and Burr 2000), and a large number of rice genes have been characterized (Zhao et al. 2015). While there is rapid progress in genomics research, great effort is needed to characterize sources of genetic diversity for future rice improvement.
Thailand is not only one of the world’s largest rice exporters but also considered to be one of the richest rice genetic resources (Vutiyano et al. 2010). Geographically, Thailand can be divided into the following four regions: the high mountains of the north, a lowland area of the central plains, the semi-arid farm lands of the northeast plateau, and the tropical islands and coast of the peninsular south. Unlike the other parts, the southern region of Thailand has distinctive climate, terrain, and resources. Rice is only cultivated in 14% of the total area of the country for local consumption (Maclean et al. 2013). The landraces maintained and cultivated by indigenous farmers likely enrich the rice gene pool for breeding new rice varieties because they have the potential gene pool to adapt to a wide range of environmental stresses (Rabara et al. 2014). As a consequence of adaptations to the unique geography and on-farm conservation, rice cultivars in the southern part of Thailand are valuable genetic resources for adaptation to environmental stressors such as water, salinity, and soil acidity and for more efficient nutrient uptake and utilization.
Monitoring the genetic diversity and beneficial alleles of rice landraces provides germplasm enhancements and additional insights into the use of landraces (Lopes et al. 2015). An effective strategy to evaluate and retain the genetic diversity of landraces is genotyping using molecular markers since genotypic data are more reliable and consistent than morphometric data. Among numerous classes of codominant markers, simple sequence repeat (SSR) markers are the most popular molecular markers for assessing genetic diversity because of their high polymorphism and use as molecular tools (Chakanda et al. 2013; Lopes et al. 2015; Singh et al. 2016; Roy et al. 2016). In recent years, insertion-deletion (InDel) markers have become more valuable genetic markers because of the simple procedures involved in analyzing them and their practicality for laboratories. These markers also exhibit high polymorphism and are abundant (Väli et al. 2008; Steele et al. 2008; Păcurar et al. 2012). Gene-based insertions or deletions usually result in loss of gene function and have been used as effective functional markers for marker-assisted selection. For example, an InDel marker in the BADH2 gene causes a non-functional allele that controls one of the most valued traits, fragrance in rice grains (Bradbury et al. 2005; Shi et al. 2008; Kovach et al. 2009). An InDel marker in the Rc gene in black and white rice causes a premature stop codon that can differentiate black and white rice from red rice (Lim and Ha 2013). Additionally, InDel markers in blast-resistant genes have become useful tools for marker-assisted selection (Hayashi et al. 2006). Moreover, InDel markers have been successfully used to differentiate indica rice from japonica rice (Steele et al. 2008; Xiong et al. 2010). In the next-generation sequencing era, a high number of InDel markers have been characterized (Liu et al. 2015; Shen et al. 2004; Yamaki et al. 2013; Wu et al. 2013) and can be utilized in the evaluation of genetic resources and genetic differentiation and in marker-assisted selection.
Due to the impacts of climate change, the genetic assessment of rice landraces is important to identify potential rice resources for rice improvement, especially in stress-related genes. In this study, genetic assessment of rice landraces in southern Thailand was conducted using InDel markers from putative stress-related genes. A detailed view of the natural allelic variation and genetic differentiation was established, and potential InDel markers for stress responses are highlighted. This study represents an initial step in facilitating the characterization, conservation, and utilization of rice genetic resources.
Materials and methods
Plant materials and DNA extraction
Nineteen populations including 12 rice landraces from South Thailand were derived from 7 districts and 4 rice research centers. Five representative sample seeds from each population were collected to evaluate genetic diversity within and between the populations. The local names, sources and rice characteristics are given in Table 1, and the geographical distribution of the samples collected from farmers is depicted in Fig. 1.
Table 1.
Local names, sources, and characteristics of rice landraces
| Landrace population | Landrace name | Source | Ecosystem | Characteristics of rice landraces | ||
|---|---|---|---|---|---|---|
| PSa | SCb | Frc | ||||
| SY | Sang Yod | Phatthalung Rice Research Center | Lowland | Yes | Red | No |
| SYKC | Sang Yod | Khao Chaison, Phatthalung | Lowland | Yes | Red | No |
| SYKS | Sang Yod | Khian Sa, Surat Thani | Upland | Yes | Red | No |
| SYRP | Sang Yod | Rattaphum, Songkhla | Lowland | Yes | Red | No |
| LN | Leb Nok | Phatthalung Rice Research Center | Lowland | Yes | White | No |
| LNKC | Leb Nok | Khao Chaison, Phatthalung | Lowland | Yes | White | No |
| LNRP | Leb Nok | Rattaphum, Songkhla | Lowland | Yes | White | No |
| LNLS | Leb Nok | Lan Saka, Nakhon Si Thammarat | Lowland | Yes | White | No |
| Ch | Chiang | Phatthalung Rice Research Center | Lowland | Yes | White | No |
| ChMC | Chiang | Mueang Chumphon, Chumphon | Lowland | Yes | White | No |
| KTRP | Khem Tawng | Rattaphum, Songkhla | Lowland | Yes | White | No |
| SB | Sebookantang 5 | Pattani Rice Research Center | Lowland | No | White | No |
| HK | Hom Kradung-Nga 59 | Pattani Rice Research Center | Lowland | Yes | Red | Yes |
| HC | Hawm Chai Ya | Surat Thani Rice Seed Center | Lowland | Yes | White | Yes |
| HH | Hawm Hua Bon | Krabi Rice Research Center | Upland | Yes | Red | Yes |
| KMSC | Khai Mod Rin | Sichon, Nakhon Si Thammarat | Lowland | Yes | White | No |
| KCRP | Khao Chaw | Rattaphum, Songkhla | Lowland | Yes | White | No |
| HCKP | Hawm Chan | Khok Pho, Pattani | Lowland | Yes | White | Yes |
| DPKS | Dawk Pa-yawm | Khian Sa, Surat Thani | Upland | Yes | White | Yes |
aPhotoperiod sensitivity
bSeed color
cFragrance
Fig. 1.

Sampling locations of 12 rice landrace populations from 7 districts in South Thailand. Note: The map was downloaded and
modified from https://upload.wikimedia.org/wikipedia/commons/5/52/Thailand_South.png and https://upload.wikimedia.org/wikipedia/commons/c/c1/Thailand_Topography.png
Five representative samples from each population were individually used for DNA extraction. For each sample, a fine powder was obtained from the seeds by grinding using a TissueLyser LT (QIAGEN, Hilden, Germany). Total genomic DNA was extracted using a DNAsecure Plant Kit (Tiangen Biotech, Beijing, China) following the manufacturer’s protocol.
Genotyping
Well-characterized InDel markers in the RFT1, BADH2, and Rc genes were chosen according to the characteristics of the collected landrace samples and their association with stress responses. The other 34 gene-based InDel markers were chosen from a previous report by Liu et al. (2015), who identified a list of 14,428 allelic InDels from data mining. The candidate pool of markers was selected according to the following criteria: markers that (1) were within a known annotated gene that might be related to stress responses, (2) had a high variation within indica rice, (3) and had an allele length variation > 8 bp. The sequences of all the primers in this study are shown in Online Resource 1.
Because there was a large number of samples and because of the low outcrossing rate of rice, sample pooling was employed to increase the efficiency of screening for polymorphic markers. Two-stage pooling strategy as described by Sham et al. (2002) was applied. DNA from 5 representative samples from each population were pooled in equal concentration into 2 groups: DNA from research centers and DNA from farmers. PCR was performed with the primers. PCR was carried out in a 25 µL reaction mixture containing 20 ng of DNA, 1X buffer, 1.5 mM MgCl2, 0.2 mM dNTPs, 0.4 µM each forward and reverse primer, and 1 U Taq DNA Polymerase (Invitrogen, USA). The PCR conditions were as follows: 5 min denaturation at 95 °C; followed by 34 cycles of 30 s at 95 °C, 30 s at 55 °C, and 30 s at 72 °C; and a final extension of 10 min at 72 °C to ensure full synthesis of the PCR fragments. The PCR products were separated on a 3% agarose gel, stained with ethidium bromide and visualized under ultraviolet light. If a marker generated multiple bands in any of the pooled samples, it might be heterozygous or contain a polymorphism. Thus, these markers were classified as putative polymorphic markers and were then genotyped in 5 representative individual DNA samples from each population using the same procedure.
Data analysis
The polymorphism and allelic distribution pattern detected across the genotypes in each population through gel-based assay were scored manually and analyzed using different computational tools and programs. The alleles per locus (A), expected heterozygosity (He), observed heterozygosity (Ho), and F-statistic (FST) were calculated using the TFPGA software (Miller 1997). The polymorphism information content (PIC) values were calculated for each primer with PIC Calculator (https://www.liv.ac.uk/~kempsj/pic.html). An allele found in fewer than 5% of the samples was considered as a rare allele. The percentage of molecular variation was calculated using analysis of molecular variance (AMOVA) in GenAlEx 6.5 (Peakall and Smouse 2012).
The genetic distance matrix and an unweighted pair-group method arithmetic average (UPGMA) topology with 1000 permutations were generated by TFPGA (Miller 1997). To summarize the patterns of variation in the multilocus dataset, principal coordinate analysis (PCoA) was performed in the GenAlEx software (Peakall and Smouse 2012) using the genetic distance matrix between the populations. The population structure of the 95 rice landrace individuals was examined based on Bayesian clustering analysis with the STRUCTURE V2.3.4 software (Pritchard et al. 2000). A model permitting admixture and the correlated allele frequency were used for the analysis. The number of clusters (K) ranging from 1 to 19 was evaluated using five replicate runs per K value. Both the burn-in period length and Markov chain Monte Carlo replications after burn-in were set to 10,000. An online program, Structure Harvester (https://taylor0.biology.ucla.edu/structureHarvester/#), was used to determine the final K value based on LnP(D) and Evanno’s ΔK (Evanno et al. 2005).
Results
Profiling of InDel markers in rice landraces from peninsular Thailand
Rice landraces from peninsular Thailand have particular adaptations to stressful environments. In this study, they were evaluated with gene-based InDel markers. Out of 37 InDel markers, 16 InDel markers (Table 2) showed allelic variation in the evaluated population and were classified as polymorphic markers. The representation of polymorphic markers between and within populations is shown in Fig. 2. Based on these 16 markers, a total of 36 alleles were obtained. Most of the loci had 2 alleles, except for Indel1922, Indel10758, and Indel13507, which had 3, 3 and 4 alleles per locus, respectively. The expected heterozygosity (He) varied from 0.12 to 0.50. Indel10758 was the most informative marker (He = 0.69), whereas Indel7190 (He = 0.12) was the least informative marker, as this marker only differentiated 2 populations from the other populations. The Ho of all the loci was 0, which was expected because of the self-pollination behavior of rice. FST, an indicator of differentiation between populations, varied from 0.46 to 1.00. The best locus differentiation between the populations was Indel-Rc. PIC, a reflection of allelic diversity and frequency, had an average value of 0.27 per locus. The PIC values ranged from 0.11 for Indel7190 to 0.43 for Indel10758.
Table 2.
Genetic characteristics of polymorphic InDel markers from 19 rice landrace populations in South Thailand
| Locus | Aa | Heb | FSTc | PICd | Related trait/putative protein |
|---|---|---|---|---|---|
| InDel-3 RFT1 | 2 | 0.32 | 0.90 | 0.27 | Photoperiod sensitivity |
| ASA | 2 | 0.40 | 0.73 | 0.32 | Fragrance |
| Indel-Rc | 2 | 0.44 | 1.00 | 0.34 | Seed color |
| Indel1922 | 3 | 0.29 | 0.76 | 0.26 | WAX2 |
| Indel2221 | 2 | 0.49 | 0.69 | 0.37 | BRASSINOSTEROID INSENSITIVE 1 |
| Indel2543 | 2 | 0.24 | 0.87 | 0.21 | Heavy metal-associated domain containing protein |
| Indel6348 | 2 | 0.31 | 0.90 | 0.26 | Aquaporin protein |
| Indel6746 | 2 | 0.24 | 0.87 | 0.21 | Gibberellin 20 oxidase 2 |
| Indel7190 | 2 | 0.12 | 0.57 | 0.11 | Sodium/calcium exchanger protein |
| Indel7447 | 2 | 0.24 | 0.87 | 0.21 | PTF1 |
| Indel7670 | 2 | 0.41 | 0.83 | 0.32 | Cadmium tolerance factor |
| Indel8538 | 2 | 0.24 | 0.87 | 0.21 | PLETHORA 2 |
| Indel10667 | 2 | 0.36 | 0.65 | 0.30 | Gibberellin 20 oxidase 2 |
| Indel10758 | 3 | 0.50 | 0.80 | 0.43 | Frigida |
| Indel12527 | 2 | 0.24 | 0.79 | 0.21 | Dihydroflavonol-4-reductase |
| Indel13507 | 4 | 0.42 | 0.46 | 0.36 | SCARECROW |
| Average | 2 | 0.33 | 0.79 | 0.27 |
aNumber of alleles per locus
bExpected heterozygosity
cF-statistic
dPolymorphic information content
Fig. 2.

Agarose gel showing the polymorphic pattern of InDel7646 between (a) and within populations (b). A: Lane M is the GeneRuler™ 1 kb DNA Ladder. Lanes 1 to 19 correspond to a representative individual from each rice landrace population listed in Table 1. B: Lanes 20 to 24 are 5 representative individuals of Hawm Hua Bon rice
Indel1922 and Indel13507 each had one rare allele. The rare allele of Indel1922 was only present in one sample of Sang Yod from Rattaphum, Songkhla and one sample of Khai Mod Rin from Sichon, Nakhon Si Thammarat. The rare allele of Indel13507 was only found in 3 genotypes of Khem Tawng from Rattaphum, Songkhla. Indel1922 and Indel13507 were annotated as the WAX2 and SCARECROW genes, respectively (Table 2).
Considering the genotypic data, unique alleles at Indel1922, -2543, -6746, -7447 and -8538 were found in all samples of Dawk Pa-yawm and Sang Yod from Khian Sa, Surat Thani and in some samples of Hawm Hua Bon from the Krabi Rice Research Center. The Dawk Pa-yawm and Hawm Hua Bon samples were upland rice. Normally, Sang Yod is a lowland rice; however, the Sang Yod samples collected from Khian Sa, Surat Thani, were grown in an upland ecosystem over time. Thus, Sang Yod collected from Khian Sa, Surat Thani was considered a type of upland rice.
The well-characterized InDel markers in the RFT1, BADH2, and Rc genes are associated with flowering time, fragrance and seed color traits, respectively. These markers were chosen because variations in flowering time, fragrance and seed color traits were observed in the studied populations. Moreover, these markers are also related to stress responses. Regarding the InDel in RFT1, a different allele was found in Sebookantang 5 and rice landraces from upland ecosystems. The fragrant rice landraces in this study included Hom Kradung-Nga 59, Hawm Chai Ya, Hawm Hua Bon, and Hawm Chan. The analysis of InDel marker in BADH2 revealed that the allele corresponding to fragrance was only found in some aromatic landrace rice samples. This indicated the loss of the allele in the populations. The allele corresponding to fragrance was also found in Sang Yod collected from Khian Sa, Surat Thani, which is a non-fragrant rice. For the red seed color trait, Sang Yod, Hom Kradung-Nga 59 and Hawm Hua Bon clearly showed the allele corresponding to red seed color.
Genetic diversity and differentiation of rice landraces from peninsular Thailand
In the present study, the genetic diversity and differentiation of 95 individual genotypes of 19 rice landrace populations were determined using the genotypic data of 16 gene-based InDel markers. The genetic parameters are given in Table 3. Heterozygosity was not observed in any of the studied samples. The mean He of the populations ranged from 0 to 0.36. Hawm Hua Bon showed the highest He and level of polymorphism (75%). He and polymorphism were not detected in some populations, meaning that some populations were homogeneous. The percentage of molecular variance was partitioned into 70% variation between populations and 30% variation within populations. The 19 rice populations showed significant genetic differentiation between populations by AMOVA (P = 0.001), suggesting significant genetic differentiation between all pair of collecting regions and cultivars.
Table 3.
Genetic characteristics of 19 rice landrace populations in South Thailand based on 16 InDel loci
| Landrace population | Aa | Nab | Hec | Pd (%) |
|---|---|---|---|---|
| SY | 18 | 1.13 | 0.04 | 12.50 |
| SYKC | 16 | 1.00 | 0.00 | 0.00 |
| SYKS | 16 | 1.00 | 0.00 | 0.00 |
| SYRP | 17 | 1.06 | 0.20 | 6.25 |
| LN | 16 | 1.00 | 0.00 | 0.00 |
| LNKC | 19 | 1.19 | 0.07 | 18.75 |
| LNRP | 17 | 1.06 | 0.02 | 6.25 |
| LNLS | 20 | 1.25 | 0.10 | 25.00 |
| Ch | 16 | 1.00 | 0.00 | 0.00 |
| ChMC | 20 | 1.25 | 0.10 | 25.00 |
| KTRP | 18 | 1.25 | 0.05 | 12.50 |
| SB | 17 | 1.06 | 0.02 | 6.25 |
| HK | 19 | 1.19 | 0.06 | 18.75 |
| HC | 19 | 1.19 | 0.08 | 18.75 |
| HH | 28 | 1.75 | 0.36 | 75.00 |
| KMSC | 20 | 1.25 | 0.10 | 25.00 |
| KCRP | 19 | 1.19 | 0.08 | 18.75 |
| HCKP | 17 | 1.06 | 0.02 | 6.25 |
| DPKS | 16 | 1.00 | 0.00 | 0.00 |
aNumber of alleles over all 16 loci
bMean number of different alleles
cExpected heterozygosity
dPercentage of polymorphic loci
For the population relationship, a phylogenetic tree was constructed based on Nei’s genetic distances between populations with 1000 bootstrap replicates. The UPGMA clustered the landraces into two main groups corresponding to lowland (group I) and upland (group II) ecosystems, as shown in Fig. 3. In addition to the Sang Yod rice from Khian Sa, Surat Thani, the other Sang Yod rice samples from farmers and the rice research center were clustered into the same group with the smallest genetic distance (0.0063). In contrast, the Leb Nok and Chiang samples from the rice research center were separated from the Leb Nok and Chiang samples from farmers.
Fig. 3.

Dendrogram of 19 rice landrace populations in South Thailand based on Nei’s genetic distances
A Bayesian-based clustering method was performed to determine the genetic structure between all 95 individual genotypes. The results of a comparison of LnP(D) and Evanno’s ΔK values by increasing K from 1 to 19 showed that the LnP(D) values increased with K. The highest LnP(D) and ΔK values were obtained at K = 2. This result supported the presence of two genetically distinct clusters among the 19 rice landraces. The population structure based on K = 2 showed similar results to the dendrogram, which sorted the rice landraces into 2 different color-coded groups (Fig. 4). Group I contained 16 lowland rice samples and a few samples of upland rice, including Hawm Hua Bon. Group II contained rice grown in the upland ecosystem. These two groups diverged at FST values of 0.595 and 0.864 for group I and group II, respectively. Similarly, a PCoA scatter plot separated the landraces into upland and lowland rice (Fig. 5). Based on the AMOVA between the two clusters, the two groups showed 9% variance between themselves, whereas 91% variance was recorded within groups.
Fig. 4.
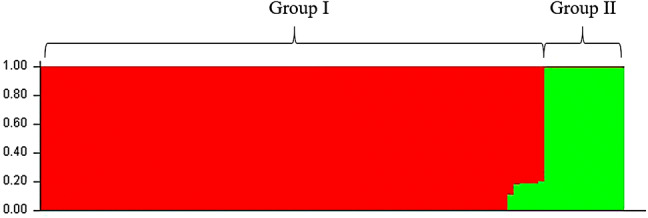
Population structure of rice landraces in South Thailand based on Bayesian cluster analysis at K = 2 using STRUCTURE
Fig. 5.

PCoA scatter diagram of 19 rice landrace populations in South Thailand
Discussion
Southern Thailand is a narrow peninsula and has a small area for paddy fields, in which rice is mainly grown for local consumption. Rice cultivated in this area experiences a different climate regime than rice cultivated elsewhere in Thailand. Consequently, the rice landraces in southern Thailand represent local adaptation over time, which therefore provides genetic resources suitable for variable stressful environments. In this study, the landraces were derived from rice research centers and collected from farmers. During sample collection, the replacement of locally adapted landraces by modern rice varieties due to the development of civilization was observed. Local landraces have been replaced by modern varieties, which have a low genetic diversity (Londo et al. 2006). Therefore, genetic diversity is being lost and must be maintained.
InDel markers have been successfully used for genetic diversity studies, genetic differentiation between indica and japonica rice, and marker-assisted selection (Shi et al. 2008; Steele et al. 2008; Kovach et al. 2009; Xiong et al. 2010; Liu et al. 2012; Sahu et al. 2017). In the present study, the use of a set of 16 InDel markers from putative stress-related genes was sufficient to evaluate rice germplasms and study the genetic diversity in rice landraces from southern Thailand. Some of these markers have the potential to differentiate upland and lowland rice. These markers are derived from putative genes involved in variable stress responses (Table 2) and therefore have the potential to be functional markers. For example, (1) the WAX2 gene is a gene involved in cuticular wax synthesis that protects the plant from environmental stresses such as water and salt stress (Chen et al. 2003; Kosma and Jenks 2007). (2) Gibberellin 20 oxidase 2 (GA20ox2), a gibberellin biosynthesis gene, acts redundantly to regulate most developmental processes, especially the flowering time and silique length (Rieu et al. 2007). In rice, GA20ox2 or SD1 regulates plant height, and loss of its function can cause semi-dwarfism (Spielmeyer et al. 2002). Moreover, quantitative trait locus analysis showed that drought stress tolerance and grain yield under drought stress were proximal to this gene (Wang et al. 2005; Venuprasad et al. 2012; Trijatmiko et al. 2014). (3) PTF1, a gene responsible for tolerance to inorganic phosphate starvation, encodes a basic helix-loop-helix domain transcription factor. The overexpression of PTF1 enhances tolerance to inorganic phosphate starvation (Yi et al. 2005). The InDels detected in these genes might therefore change the gene functions and are useful for rice improvement. Further functional analysis of each gene will provide more information for the potential use of each gene in marker-assisted selection. Rare alleles were found in WAX2 and SCARECROW; therefore, using the associated markers will be a powerful tool for the conservation of rice containing these alleles.
The studied populations show variations in flowering time, fragrance and seed color. As a short-day plant, rice flowers respond to a short-day photoperiod. However, there is a divergence in flowering time under long-day conditions. An amino acid substitution in RFT1 causes defective RFT1 proteins, leading to late flowering under long-day conditions. A number of markers in RFT1 linked to the amino acid substitution have been reported, including InDel-3 RFT1 (Ogiso-Tanaka et al. 2013). Therefore, the InDel-3 RFT1 marker was used to detect alleles corresponding to photoperiod insensitivity in this study. Sebookantang 5 is the only photoperiod-insensitive rice in the evaluated population. Surprisingly, the photoperiod-insensitivity allele was not only found in Sebookantang 5 but also found in the upland rice. In addition to showing photoperiod response, RFT1 also responds to drought stress (Galbiati et al. 2016). Therefore, this allele is possibly important for plant adaptation to the upland ecosystem or to drought stress condition. In rice, non-functional BADH2 results in fragrant rice, though BADH2 in some plants responds to drought and salt stresses (Fitzgerald et al. 2009). In the evaluated population, a non-functional BADH2 allele was not only found in fragrant rice but also found in Sang Yod from Khian Sa, Surat Thani, which is a non-fragrant rice grown in an upland ecosystem. Therefore, it can be inferred that the non-functional allele in BADH2 might be playing a vital role in abiotic stress adaptation. Evidently, the study by Niu et al. (2008) exhibiting down regulation of OsBADH2 in non-fragrant rice resulting into reduction in plant height and crop productivity is also in congruence with the aforementioned perspective. Seed color is related to antioxidants. For example, the red colour in rice seeds is due to proanthocyanidin, which has important prohibitive effects on pathogens and predators (Sweeney et al. 2006). In rice, Rc is a gene required for red seed color, and Indel-Rc clearly differentiated red coloured seed from white coloured seed. Since seed color is visible to the naked eye, the samples used in this study could also be easily differentiated according to their visual characteristics, which showed correspondence with the presence of correct alleles in them. Nevertheless, using markers to identify and select the trait is helpful in screening of samples, especially at the early stages of plant development.
Based on the dendrogram, population structure and PCoA scatter plot, this set of InDel markers demonstrated their potential to separate upland from lowland rice. To ensure their ability to differentiate between rice from upland and lowland ecosystems, more diverse upland and lowland rice should be examined. Upland rice is grown in dry soil and is known to be resistant to water stress. In contrast, lowland rice is grown in flooded rice paddies and are commonly susceptible to water stress (Wang et al. 2007). In the present study, five markers were only found in rice from the upland ecosystem and these markers encoded WAX2, heavy metal-associated domain-containing protein, GA20ox2, PTF1, and PLETHORA2. As mentioned previously, not only WAX2 and GA20ox2 but also PLETHORA2 are involved in drought and salt stress tolerance (Shukla et al. 2006). The alleles of the genes corresponding to these proteins that were found in the upland rice might therefore be important materials for drought and salt stress studies. Upland rice is typically grown in low-input production systems; thus, the allele found in the PTF1 gene from upland rice possibly plays a role in increasing tolerance to inorganic phosphate starvation. Further studies should evaluate these markers in large populations of rice with different phenotypes. Collectively, the set of markers used in this study therefore not only can separate lowland and upland rice but also can be used as functional markers for breeding of tolerance to water deficit, salinity and inorganic phosphate starvation traits in rice.
Every individual plant is genetically unique by nature; therefore, genetic variation within the populations was assessed. A few genetic variations within populations were found in both on-farm and ex-situ conservation samples. Therefore, genetic evaluations for conservation management should be performed individually.
Conclusion
The findings of the present study reveal both potential markers and diverse landraces for rice breeding. InDel markers offer an effective tool for genetic monitoring and assessment. At the technical level, genotyping of InDel markers is easy for most laboratories, and the procedure is simple. Moreover, InDel markers are reliable and informative. Therefore, InDel markers are good choice for the genetic evaluation of rice. The set of polymorphic InDel markers used in this study were able to differentiate upland and lowland rice. The landraces in South Thailand are valuable genetic resources because they have diverse alleles that might be beneficial for future rice improvement. The landraces from the upland ecosystem usually contain different alleles compared to landraces from other ecosystems. Genetic assessment of rice landraces should be performed individually. Further research should also focus on the characterization of each gene function and trait association to provide information for marker-assisted selection.
Electronic supplementary material
Below is the link to the electronic supplementary material.
Acknowledgements
This work was supported by the government budget of Prince of Songkla University (Grant No. SCI601435S) and the Postdoctoral Fellowship from Prince of Songkla University awarded to SW. We appreciate Phatthalung Rice Research Center, Pattani Rice Research Center, Krabi Rice Research Center, Surat Thani Rice Seed Center, and the farmers for providing the rice landrace seeds used in this study. The assistance of Miss Wilasinee Moenard is gratefully acknowledged.
Author contributions
SW and AP conceived and planned the work. KR prepared the plant materials. SW and SK performed genotyping. SW analyzed the data and wrote the paper. All authors read and provided helpful discussions for the manuscript. SW and AP made revisions and approved the final version of the paper.
Compliance with ethical standards
Conflict of interest
The authors state that they do not have any conflict of interest.
Footnotes
Publisher's Note
Springer Nature remains neutral with regard to jurisdictional claims in published maps and institutional affiliations.
References
- Bradbury LMT, Henry RJ, Jin Q, et al. A perfect marker for fragrance genotyping in rice. Mol Breed. 2005;16:279–283. doi: 10.1007/s11032-005-0776-y. [DOI] [Google Scholar]
- Chakanda R, van Treuren R, Visser B, van den Berg R. Analysis of genetic diversity in farmers’ rice varieties in Sierra Leone using morphological and AFLP® markers. Genet Resour Crop Evol. 2013;60:1237–1250. doi: 10.1007/s10722-012-9914-7. [DOI] [Google Scholar]
- Chen X, Goodwin SM, Boroff VL, et al. Cloning and characterization of the WAX2 gene of Arabidopsis involved in cuticle membrane and wax production. Plant Cell. 2003;15:1170–1185. doi: 10.1105/tpc.010926. [DOI] [PMC free article] [PubMed] [Google Scholar]
- Evanno G, Regnaut S, Goudet J. Detecting the number of clusters of individuals using the software structure: a simulation study. Mol Ecol. 2005;14:2611–2620. doi: 10.1111/j.1365-294X.2005.02553.x. [DOI] [PubMed] [Google Scholar]
- Fitzgerald TL, Waters DLE, Henry RJ. Betaine aldehyde dehydrogenase in plants. Plant Biol. 2009;11:119–130. doi: 10.1111/j.1438-8677.2008.00161.x. [DOI] [PubMed] [Google Scholar]
- Galbiati F, Chiozzotto R, Locatelli F, et al. Hd3a, RFT1 and Ehd1 integrate photoperiodic and drought stress signals to delay the floral transition in rice. Plant Cell Environ. 2016;39:1982–1993. doi: 10.1111/pce.12760. [DOI] [PubMed] [Google Scholar]
- Hayashi K, Yoshida H, Ashikawa I. Development of PCR-based allele-specific and InDel marker sets for nine rice blast resistance genes. Theor Appl Genet. 2006;113:251–260. doi: 10.1007/s00122-006-0290-6. [DOI] [PubMed] [Google Scholar]
- Kosma DK, Jenks MA. Eco-physiological and molecular-genetic determinants of plant cuticle function in drought and salt stress tolerance. In: Jenks MA, Hasegawa PM, Jain SM, editors. Advances in molecular breeding toward drought and salt tolerant crops. Dordrecht: Springer; 2007. pp. 91–120. [Google Scholar]
- Kovach MJ, Calingacion MN, Fitzgerald MA, McCouch SR. The origin and evolution of fragrance in rice (Oryza sativa L.) Proc Natl Acad Sci USA. 2009;106:14444–14449. doi: 10.1073/pnas.0904077106. [DOI] [PMC free article] [PubMed] [Google Scholar]
- Li Z-K, Zhang F. Rice breeding in the post-genomics era: from concept to practice. Curr Opin Plant Biol. 2013;16:261–269. doi: 10.1016/J.PBI.2013.03.008. [DOI] [PubMed] [Google Scholar]
- Lim SH, Ha SH. Marker development for the identification of rice seed color. Plant Biotechnol Rep. 2013;7:391–398. doi: 10.1007/s11816-013-0276-1. [DOI] [Google Scholar]
- Liu J, Li J, Qu J, Yan S. Development of genome-wide insertion and deletion polymorphism markers from next-generation sequencing data in rice. Rice (NY) 2015;8:63. doi: 10.1186/s12284-015-0063-4. [DOI] [PMC free article] [PubMed] [Google Scholar]
- Liu P, Cai XX, Lu BR. Single-seeded InDel fingerprints in rice: An effective tool for indica-japonica rice classification and evolutionary studies. J Syst Evol. 2012;50:1–11. doi: 10.1111/j.1759-6831.2011.00173.x. [DOI] [Google Scholar]
- Londo JP, Chiang YC, Hung KH, et al. Phylogeography of Asian wild rice, Oryza rufipogon, reveals multiple independent domestications of cultivated rice, Oryza sativa. Proc Natl Acad Sci USA. 2006;103:9578–9583. doi: 10.1073/pnas.0603152103. [DOI] [PMC free article] [PubMed] [Google Scholar]
- Lopes MS, El-Basyoni I, Baenziger PS, et al. Exploiting genetic diversity from landraces in wheat breeding for adaptation to climate change. J Exp Bot. 2015;66:3477–3486. doi: 10.1093/jxb/erv122. [DOI] [PubMed] [Google Scholar]
- Maclean J, Hardy B, Hettel G. Rice almanac. 4. Los Baños: International Rice Research Institute; 2013. [Google Scholar]
- Miller MP (1997) Tools for population genetic analysis (TFPGA) 1.3: a windows program for the analysis of allozyme and molecular population genetic data
- Niu X, Tang W, Huang W, et al. RNAi-directed downregulation of OsBADH2 results in aroma (2-acetyl-1-pyrroline) production in rice (Oryza sativa L.) BMC Plant Biol. 2008;8:100. doi: 10.1186/1471-2229-8-100. [DOI] [PMC free article] [PubMed] [Google Scholar]
- Ogiso-Tanaka E, Matsubara K, Yamamoto S, et al. Natural variation of the RICE FLOWERING LOCUS T 1 contributes to flowering time divergence in rice. PLoS ONE. 2013;8:e75959. doi: 10.1371/journal.pone.0075959. [DOI] [PMC free article] [PubMed] [Google Scholar]
- Păcurar DI, Păcurar ML, Street N, et al. A collection of INDEL markers for map-based cloning in seven Arabidopsis accessions. J Exp Bot. 2012;63:2491–2501. doi: 10.1093/jxb/err422. [DOI] [PMC free article] [PubMed] [Google Scholar]
- Peakall R, Smouse PE. GenAlEx 6.5: genetic analysis in Excel. Population genetic software for teaching and research–an update. Bioinformatics. 2012;28:2537–2539. doi: 10.1093/bioinformatics/bts460. [DOI] [PMC free article] [PubMed] [Google Scholar]
- Pritchard JK, Stephens M, Donnelly P. Inference of population structure using multilocus genotype data. Genetics. 2000;155:945–959. doi: 10.1093/genetics/155.2.945. [DOI] [PMC free article] [PubMed] [Google Scholar]
- Rabara R, Ferrer M, Diaz C, et al. Phenotypic diversity of farmers’ traditional rice varieties in the philippines. Agronomy. 2014;4:217–241. doi: 10.3390/agronomy4020217. [DOI] [Google Scholar]
- Rieu I, Ruiz-Rivero O, Fernandez-Garcia N, et al. The gibberellin biosynthetic genes AtGA20ox1 and AtGA20ox2 act, partially redundantly, to promote growth and development throughout the Arabidopsis life cycle. Plant J. 2007;53:488–504. doi: 10.1111/j.1365-313X.2007.03356.x. [DOI] [PubMed] [Google Scholar]
- Roy S, Marndi BC, Mawkhlieng B, et al. Genetic diversity and structure in hill rice (Oryza sativa L.) landraces from the North-Eastern Himalayas of India. BMC Genet. 2016;17:107. doi: 10.1186/s12863-016-0414-1. [DOI] [PMC free article] [PubMed] [Google Scholar]
- Sahu PK, Mondal S, Sharma D, et al. InDel marker based genetic differentiation and genetic diversity in traditional rice (Oryza sativa L.) landraces of Chhattisgarh, India. PLoS One. 2017;12:e0188864. doi: 10.1371/journal.pone.0188864. [DOI] [PMC free article] [PubMed] [Google Scholar]
- Sasaki T, Burr B. International Rice Genome Sequencing Project: the effort to completely sequence the rice genome. Curr Opin Plant Biol. 2000;3:138–142. doi: 10.1016/S1369-5266(99)00047-3. [DOI] [PubMed] [Google Scholar]
- Sham P, Bader JS, Craig I, et al. DNA pooling: a tool for large-scale association studies. Nat Rev Genet. 2002;3:862–871. doi: 10.1038/nrg930. [DOI] [PubMed] [Google Scholar]
- Shen Y-J, Jiang H, Jin J-P, et al. Development of genome-wide DNA polymorphism database for map-based cloning of rice genes. Plant Physiol. 2004;135:1198–1205. doi: 10.1104/pp.103.038463. [DOI] [PMC free article] [PubMed] [Google Scholar]
- Shi W, Yang Y, Chen S, Xu M. Discovery of a new fragrance allele and the development of functional markers for the breeding of fragrant rice varieties. Mol Breed. 2008;22:185–192. doi: 10.1007/s11032-008-9165-7. [DOI] [Google Scholar]
- Shukla RK, Raha S, Tripathi V, Chattopadhyay D. Expression of CAP2, an APETALA2-family transcription factor from chickpea, enhances growth and tolerance to dehydration and salt stress in transgenic tobacco. Plant Physiol. 2006;142:113–123. doi: 10.1104/pp.106.081752. [DOI] [PMC free article] [PubMed] [Google Scholar]
- Singh N, Choudhury DR, Tiwari G, et al. Genetic diversity trend in Indian rice varieties: an analysis using SSR markers. BMC Genet. 2016;171(6):e27565. doi: 10.1371/journal.pone.0027565. [DOI] [PMC free article] [PubMed] [Google Scholar]
- Spielmeyer W, Ellis MH, Chandler PM. Semidwarf (sd-1), "green revolution" rice, contains a defective gibberellin 20-oxidase gene. Proc Natl Acad Sci USA. 2002;99:9043–9048. doi: 10.1073/pnas.132266399. [DOI] [PMC free article] [PubMed] [Google Scholar]
- Steele KA, Ogden R, McEwing R, et al. InDel markers distinguish Basmatis from other fragrant rice varieties. F Crop Res. 2008;105:81–87. doi: 10.1016/j.fcr.2007.08.001. [DOI] [Google Scholar]
- Sweeney MT, Thomson MJ, Pfeil BE, McCouch S. Caught red-handed: Rc encodes a basic helix-loop-helix protein conditioning red pericarp in rice. Plant Cell. 2006;18(2):283–294. doi: 10.1105/tpc.105.038430. [DOI] [PMC free article] [PubMed] [Google Scholar]
- Trijatmiko KR, Supriyanta PJ, et al. Meta-analysis of quantitative trait loci for grain yield and component traits under reproductive-stage drought stress in an upland rice population. Mol Breed. 2014;34:283–295. doi: 10.1007/s11032-013-0012-0. [DOI] [PMC free article] [PubMed] [Google Scholar]
- Väli Ü, Brandström M, Johansson M, Ellegren H. Insertion-deletion polymorphisms (indels) as genetic markers in natural populations. BMC Genet. 2008;9:8. doi: 10.1186/1471-2156-9-8. [DOI] [PMC free article] [PubMed] [Google Scholar]
- Venuprasad R, Bool ME, Quiatchon L, et al. A large-effect QTL for rice grain yield under upland drought stress on chromosome 1. Mol Breed. 2012;30:535–547. doi: 10.1007/s11032-011-9642-2. [DOI] [Google Scholar]
- Vutiyano C, Vanavichit A, Chitrakon S, Toojinda T. Wild rice genetic resources in Thailand. Thai Agric Res J. 2010;28:215. [Google Scholar]
- Wang H, Zhang H, Gao F, et al. Comparison of gene expression between upland and lowland rice cultivars under water stress using cDNA microarray. Theor Appl Genet. 2007;115:1109–1126. doi: 10.1007/s00122-007-0637-7. [DOI] [PubMed] [Google Scholar]
- Wang XS, Zhu J, Mansueto L, Bruskiewich R. Identification of candidate genes for drought stress tolerance in rice by the integration of a genetic (QTL) map with the rice genome physical map. J Zhejiang Univ Sci B. 2005;6:382–388. doi: 10.1631/jzus.2005.B0382. [DOI] [PMC free article] [PubMed] [Google Scholar]
- Wu DH, Wu HP, Wang CS, et al. Genome-wide InDel marker system for application in rice breeding and mapping studies. Euphytica. 2013;192:131–143. doi: 10.1007/s10681-013-0925-z. [DOI] [Google Scholar]
- Xiong Z, Zhang S, Wang Y, et al. Differentiation and distribution of indica and japonica rice varieties along the altitude gradients in Yunnan Province of China as revealed by InDel molecular markers. Genet Resour Crop Evol. 2010;57:891–902. doi: 10.1007/s10722-009-9528-x. [DOI] [Google Scholar]
- Yamaki S, Ohyanagi H, Yamasaki M, et al. Development of INDEL markers to discriminate all genome types rapidly in the genus Oryza. Breed Sci. 2013;63:246–254. doi: 10.1270/jsbbs.63.246. [DOI] [PMC free article] [PubMed] [Google Scholar]
- Yi K, Wu Z, Zhou J, et al. OsPTF1, a novel transcription factor involved in tolerance to phosphate starvation in rice. Plant Physiol. 2005;138:2087–2096. doi: 10.1104/pp.105.063115. [DOI] [PMC free article] [PubMed] [Google Scholar]
- Zhao J, Chen H, Ren D, et al. Genetic interactions between diverged alleles of Early heading date 1 ( Ehd1) and Heading date 3a ( Hd3a ) / RICE FLOWERING LOCUS T1 ( RFT1) control differential heading and contribute to regional adaptation in rice ( Oryza sativa ) New Phytol. 2015;208:936–948. doi: 10.1111/nph.13503. [DOI] [PubMed] [Google Scholar]
Associated Data
This section collects any data citations, data availability statements, or supplementary materials included in this article.