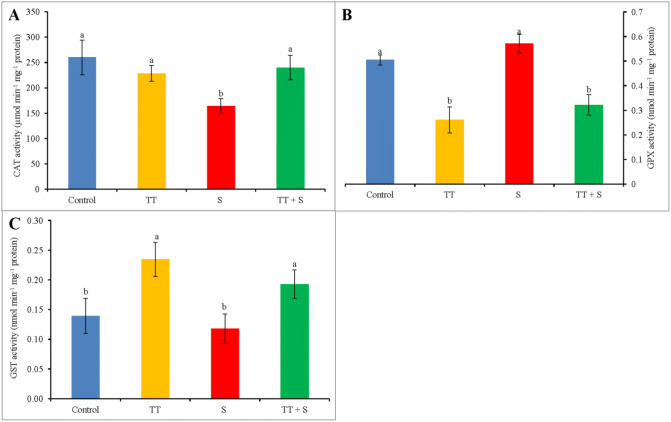
Fig. 7.
Effect of TEB and TRI on CAT (A), GPX (B), and GST (C) activity in the leaves of 10-day-old wheat seedlings under salt stress. TT and S indicate 1.375 µM TEB + 0.5 µM TRI and 250 mM NaCl, respectively. Means (± SD) were calculated from three replicates for each treatment. Bars with different letters are significantly different at P ≤ 0.05 applying Fisher’s LSD test

