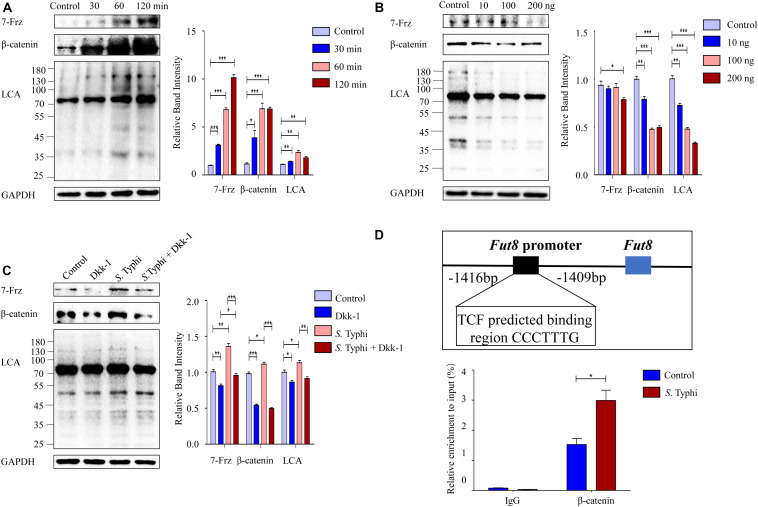
FIGURE 6.
Wnt signaling pathway mediates the core fucosylation of Caco-2 by S. Typhi infection in vitro. (A) The expression of 7-Frz, β-catenin and core fucosylation of Caco-2 cells were up-regulated post infection. Caco-2 cells were incubated with S. Typhi for 30 min, washed, and incubated in fresh DMEM with 10% fetal bovine serum for 30, 60, or 120 min. Control group indicates without bacterial treatment. Data are shown as mean values ± SEM (Control, n = 3; 30 min, n = 3; 60 min, n = 3; 120 min, n = 3; ns, not significant; *p < 0.05, **p < 0.01, ***p < 0.001). (B) The expression of 7-Frz and β-catenin of Caco-2 cells was up-regulated after application of Dkk-1. The cells were divided into control group (group Control) and experimental group (group 10, 100, and 200 ng) according to the completely random method. The dose of Dkk-1 for experimental group: 10, 100, and 200 ng. Data are shown as mean values ± SEM (Control, n = 3; 10 ng, n = 3; 100 ng, n = 3; 200 ng, n = 3; ns, not significant; *p < 0.05, **p < 0.01, ***p < 0.001). (C) Caco-2 cells were classified into Control group (cells without any treatment), Dkk group (cells were treated by 2 × 10⁴ ng/mL, 10 μl Dkk-1 for 48 h), S. Typhi group (cell were incubated with S. Typhi strain for 30 min, and incubated with medium for 60 min), S. Typhi + Dkk group (cell were incubated with S. Typhi strain for 60 min, and incubated with medium for 60 min then treated by 2 × 10⁴ ng/mL, 10 μl Dkk-1 for 48 h). Data are shown as mean values ± SEM (Control, n = 3; Dkk-1, n = 3; S. Typhi, n = 3; S. Typhi + Dkk-1, n = 3; ns, not significant; *p < 0.05, **p < 0.01, ***p < 0.001). (D) The interaction between β-catenin/TCF complexes and Fut8 promoter was analyzed by ChIP analysis. TCF can directly bound to the Fut8 promoter, and S. Typhi infection increased the inputs. Caco-2 cells were incubated with S. Typhi for 30 min, washed, and incubated in fresh DMEM with 10% fetal bovine serum for 60 min. Control group indicates without bacterial treatment. Normalized inputs of chromatin DNA from Caco-2 cells were pulled down with anti-β-catenin or negative IgG antibodies. Data are shown as mean values ± SEM (Control, n = 3; S. Typhi, n = 3; *p < 0.05).

