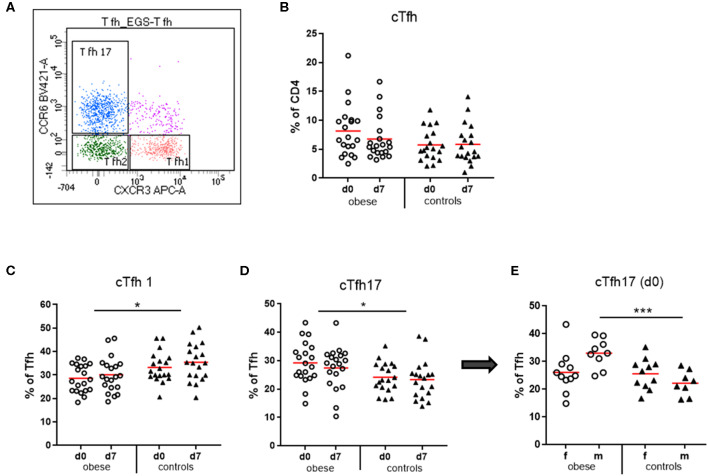
Figure 7.
Quantification of circulating T follicular helper cells (cTfh) and cTfh1, cTfh2, and cTfh17 subsets. Peripheral blood mononuclear cells were stained with fluorochrome-labeled mAbs and analyzed on a BD FACS Canto II flow cytometer. (A) Scatterplot of total cTfh (CD3+/CD4+/CD45RA−/CXCR5+) with respective expression of CXCR3 and/or CCR6 to distinguish cTfh1, cTfh2, and cTfh17 subsets. CXCR3+CCR6− cell are cTfh1 cells; CXCR3−CCR6− are cTfh2 cells, and CXCR3−CCR6+ cells are cTfh17 cells. (B) Quantification of cTfh (CD3+/CD4+/CD45RA−/CXCR5+) before (d0) and 1 week (d7) after booster vaccination as % of total CD4+ T cells. (C) cTfh1 and (D) cTfh17 cells as % of total cTfh before (d0) and 1 week (d7) after booster; line is arithmetic mean. (E) cTfh17 cells as % of total cTfh before TBE booster (d0) in females and males. Analysis of variance with linear contrasts; *p ≤ 0.05; ***p ≤ 0.05.

