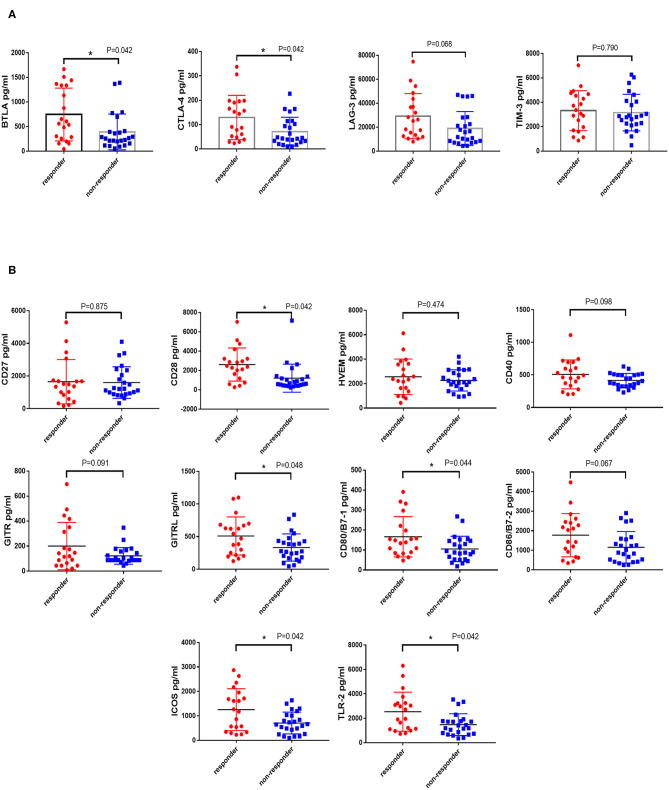
Figure 4.
Difference expression of co-inhibitory and co-stimulatory factors in responders and non-responders. The levels of four co-inhibitory factors (BTLA, TIM-3, LAG-3, and CTLA-4) and several co-stimulatory factors (CD27, CD28, CD40, HVEM, TLR-2, GITR, GITRL, ICOS, CD80, and CD86) on patients' serum were measured by the MILLIPLEX magnetic bead assay. Characterization of co-inhibitory (A) and co-stimulatory factors (B) expression in patients who responded or non-responded to PD-1 inhibitors were compared by the Unpaired Student's t-test. P-values less than 0.05 was considered that there existed statistical differences (*P < 0.05). P-values were corrected by FDR (False discovery rate) of Multiple Comparisons Correction.

