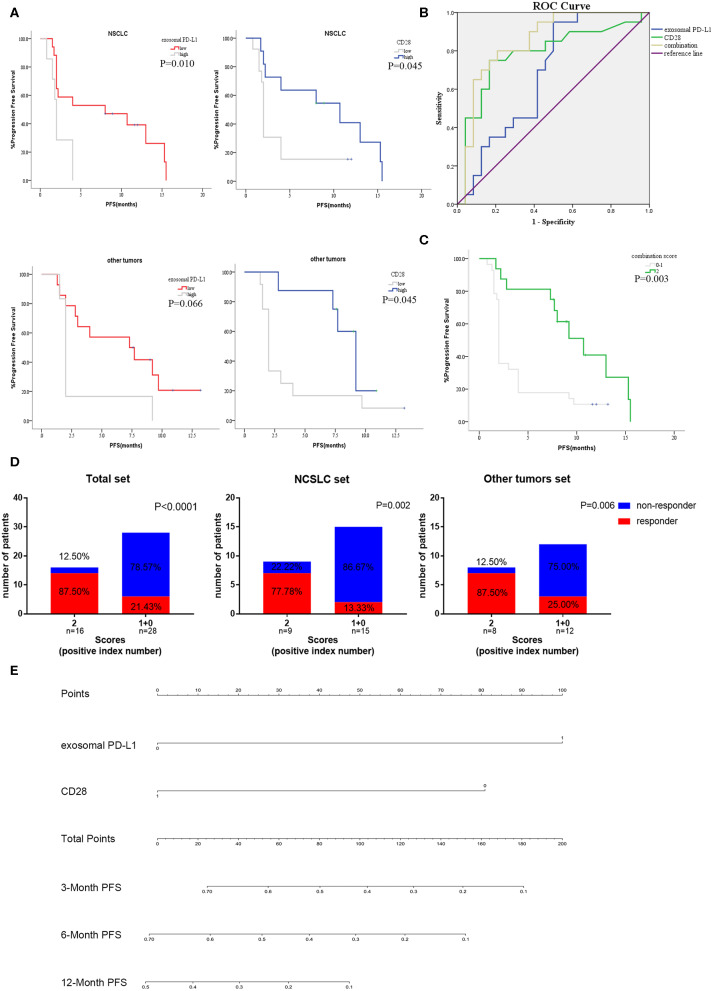
Figure 6.
Subgroup analysis and efficiency verification of the combination of exosomal PD-L1 and CD28. (A) The anti-PD-1 treatment PFS of exosomal PD-L1 and CD28 in subgroup analysis [NSCLC cohort (N = 24) and other tumors cohort (N = 20)] were performed by Kaplan-Meier curves. P-values less than 0.05 was considered that there existed statistical differences. (B) Performance comparation between the two-indexes combination and single-index were illustrated by AUC of ROC. (C) Kaplan–Meier curves for PFS of anti-PD-1 therapy in the high scored group (two positive indexes) and low scored group (none or one positive index). P-values less than 0.05 was considered that there existed statistical differences. (D) Response rate of all patients, NSCLC set (N = 24) and other tumors set (N = 20) between high scored group (two positive indexes) and low scored group (none or one positive index) were compared by the Unpaired Student's t-test. P-values less than 0.05 was considered that there existed statistical differences. (E) Nomogram demonstrated the relationship between the expression of two-indexes and the PFS rate of anti-PD-1 therapy. The total points were accumulated in exosomal PD-L1 and CD28 points. The rate of 3, 6, and 12-month PFS of anti-PD-1 therapy was calculated according to the total points of patients.

