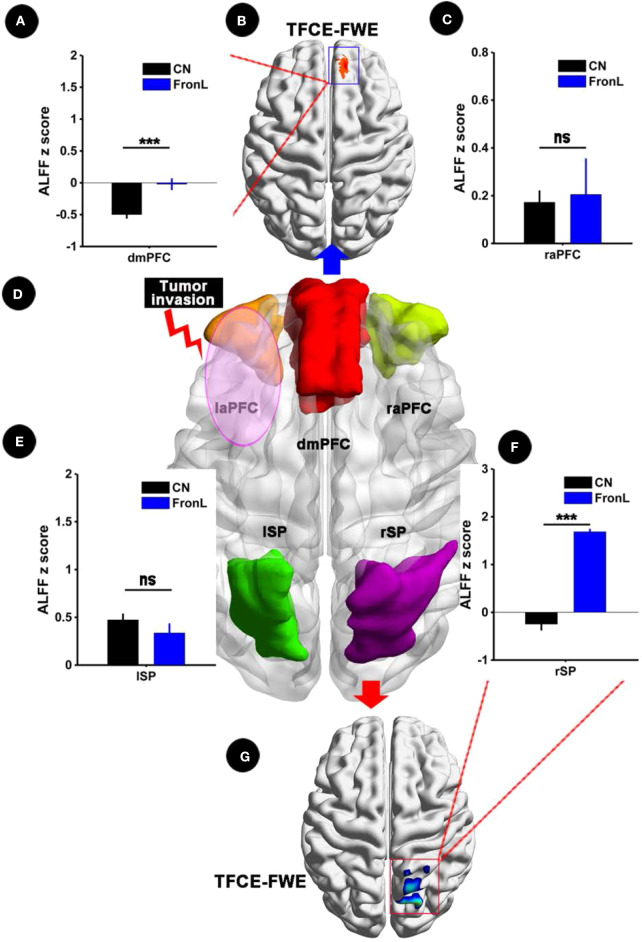
Figure 2.
ALFF analysis comparing FronL patients with CNs. ALFF within the CCN in a tumor invading the left frontal lobe compared to a CN. ALFF z scoreS are presented as the mean ± SD in (A,C,E,F). (D) Shows five nodes within the CCN in tumors invading the left frontal lobe. (B,G) Shows the brain regions of ALFF differences in the CCN in tumors invading the left frontal lobe compared to CNs. ***All results were thresholded at a voxel-wise P < 0.05 (threshold-free cluster enhancement family-wise error, TFCE FWE corrected) and cluster size >30 voxels; ns, not significant. DmPFC, dorsal mPFC (similar to superior medial frontal gyrus in AAL template); laPFC, left anterior PFC; raPFC, right anterior PFC; lSP, left superior parietal lobe; rSP, right superior parietal lobe; CN, controls; FrontL, patients with left frontal glioma; ALFF, amplitude of low frequency fluctuation.

